
Fitbit' Q1 2017 Results Highlight Inventory And Average Selling Price Reductions
Fitbit (FIT) reported rather dismal Q1 2017 metrics last week, but even so shares of FIT rose sharply. Why you might ask? As I mentioned in the article Fitbit Retrenches: The Bottoming Phase For A Hardware Company, FIT shares were already expressing a valuation that assumed the worst for the company, trading near book value.
“Shares of FIT likely won’t appreciate or maintain any meaningful appreciation in 2017 as the stock has been placed in “show me” status. Again, in the $5 price level shares are already baking in 2017 metric declines. This is rather unusual, to find a stock exhibiting a restructuring valuation so quickly.”
Within the aforementioned forecasting of the share price, FIT is already giving back some of the post earnings release gains. I would be of the opinion that the share price will dip below $6 a share in the near-term as the company still has a great deal of work ahead in order to return to profitability. In terms of the reported results, Fitbit offered the following for the Q1 2017 period:
- Fitbit sold 3 million devices in the first quarter at an average selling price of $96, generating $299 million of revenue in the quarter.
- From a growth perspective, EMEA remains a bright spot with revenue up 29% on a constant currency basis to $88 million or 29% of revenue.
- U.S. sales were $170 million, representing 57% of revenue.
- Asia Pac sales were $21 million, representing 7% of revenue.
- Americas, excluding the U.S., sales were $20 million, representing 7% of revenue.
- Gross margins declined 660 basis points year-over-year, but in line with forecast and full-year guidance of 42% to 44%. The decrease in gross margin was primarily due to a change in mix as well as excess component materials and manufacturing capacity.
- Pricing declined approximately 4% on a year-over-year basis with fewer Blaze devices sold and a greater number of Charge 2 and Alta and Alta HR devices sold. Our Flex 2 product remains the exception with relatively high inventory levels in the channel. Accessory and other revenue in the quarter added an additional $4.70 of revenue per device.
- Adjusted EBITDA loss totaled $52 million, equating to a non-GAAP loss of $0.15 per share. This beat analysts’ estimates of roughly ($.18) a share.
- Ended the first quarter with $726 million of cash and short-term investments and no debt. This is an increase of $20 million from the end of Q4 2016.
- Free cash flow generated in the quarter was $21 million.
- Sold 3 million devices and generated $299 million revenue in the first quarter.
So why did shares of FIT rise even as the company reported a decline on most every major/important metric? The declines were highly anticipated and known, but even as the earnings loss was a slight beat, this had no relevance with regards to investor sentiment and did not warrant the outperformance in the share price on earnings day. Ultimately, for a hardware manufacturer that has proven to saturate the marketplace with its devices the objective is to reduce channel inventory as demand is slowing for the devices. During Fitbit’s Q4 2016 earnings release, the company offered its dedicated strategy to reducing channel inventory, taking markdowns and generally working off it’s inflated inventory among retail and distribution partners. It’s during this time period that the company is less focused on sell-in and more focused on sell-through. For those not familiar with the sell-in/sell-through terminology, this is a key to understanding how hardware manufacturers report and operate.
Sell-in is the action of a hardware manufacturer selling its product/devices to a retail and/or distribution partner. It is not a sale to a consumer. Sell-in results are reported by hardware manufacturers, not sell-through. Hardware manufacturers can offer sentiment, when reporting results, with regards to sell-through. Sell-through is the action of a retail/distribution partner selling a device to an actual consumer or end-user of the device. For example:
- Fitbit sells devices to Best Buy (BBY) = Sell-in
- Best Buy sells device to customer = Sell-through
- Fitbit sells devices to India distribution partner = Sell-in
- India distribution partner sells devices to Best Price India =Sell-through
Getting back to why shares of FIT rose after a rather poor Q1 2017 performance regarding reported metrics. Fitbit informed investors and analysts alike that during the Q1 2017 period the company was able to reduce its channel inventory by roughly 30 percent.
“To highlight this using the U.S. market as a proxy, inventory in the channel declined 30%. Based upon current trends, we are feeling more confident that we will enter the back half of 2017 with a relatively clean channel and expect U.S. selling unit and revenue growth to more closely match U.S. sell-through unit and revenue growth.”
The claim offered by Fitbit’s executive team is a strong one. Fitbit states that in the back half of 2017, it will have a clean inventory channel. This is critical, as the company will be launching its first mainstream smartwatch during the fall months. New product/s will demand shelf space and an increased average selling price, for which retail partners will need clean inventory to invest in the product/s. The cleaner or more representative of categorical demand the inventory channel is, the greater inventory the retail partner can invest for the new product/s.
Another feather in the cap of Fitbit during the Q1 2017 period came from the strength in its direct-to-consumer business. The Fitbit.com channel continued to gain share, expanding from less than 10% of revenue in 2016 to 13% in the first quarter. The intention is to have a suite of product offerings that address the wearable category at large, whether connected health and fitness trackers, smartwatches and eventually, offerings beyond the wrist. And don’t get to excited about the beyond the wrist commentary as beyond the wrist can define a great many things. One such meaning can detail an offering of ear buds, as is slated for sale and usage with the soon to be launched Fitbit smartwatch.
Fitbit, like most hardware manufacturers has a problem of a “one and done sale”. Because it sells a non-essential consumer good, the consumer will generally purchase one device and never again make a like purchase of the device. In other words, Fitbit does not offer a recurring revenue business model, just like GoPro (GPRO) and unlike SodaStream (SODA), which offers CO2 as a recurring revenue stream. But that is exactly what the company is attempting to address with the development of an app store and subscription services. Once again, don’t get too excited as these efforts will take a few years to materialize and impact sales and earnings, if they ever do. Moreover, the historic attempts surrounding these efforts that haven’t worked for BlackBerry (BBRY), Pebble and others identify why investors should greatly quell their enthusiasm. Creating an app store is easy enough, creating consistently growing and material sales from an app store is incredibly difficult, especially with apps themselves being found with fleeting usage by consumers. Most apps are disregarded from usage 30 days after initial use or download.
Andrew Chen notes the following on his website:
“In an article published on his website, Silicon Valley analyst Andrew Chen attests that the average app loses 77 percent of its users in the three days after they install it. After a month, 90 percent of users eventually stop using the app, and by the 90-day mark, only 5 percent of users continue using a given app. These crushing figures mean that app creators are having to make sure that their users stay connected (but not annoyed by) their apps from minute one to three months down the line.”
In the same sentiment, the subscription and/or premium services Fitbit aims to grow are also a tough task. Such subscriptions have a high attrition rate not unlike the general device usage attrition rate, which is roughly 50 percent. Fitbit had acquired FitStar a couple of years ago and has yet to witness any material sales from the acquisition that offers subscription services to Fitbit users. Fitbit’s CFO offers the following with regards to subscription services from FitStar on the Q1 2017 conference call with investors and analysts.
“While still immaterial, FitStar revenue grew approximately 40% on a year-over-year basis and highlights the opportunity that comes from a more tightly integrated approach.”
FitStar represents less than 1% of total Fitbit sales, which is far less than its enterprise side of the business. While a great deal has been made concerning Fitbit’s venture into providing devices and services to corporates over the last couple of years, it has amounted to very little thus far. The enterprise side of the Fitbit business represents less than 10% of total Fitbit revenues, but the firm believes a growth path is defined. Alongside its Group Health initiatives, this business segment may be reported separately from the consumer business by 2018 and should it achieve greater scale. With partnerships in Group Health such as United Health and enterprise partnerships such as Target Corp. (TGT), Fitbit believes this business segment can provide greater predictability in the cadence of future sales.
Most every reported, regional sales segment declined for Fitbit during the Q1 period, shy of EMEA or greater Europe and the Middle East. Having said that, again, don’t get too excited, as it is very likely that this region will find sales declining in the near-mid-term. Frankly speaking, once the region is found to have been saturated like the rest of the world, sell-in will decline as sell-through is not an outlier when compared to the rest of the world. Fitbit does not have specific data on sell-through coming out of the region as noted on the recent conference call and when asked about sell-through directly.
“James Park
Yes, and on the sell-through question, we don't have specific sell-through data for EMEA, but we are carefully monitoring inventory levels. I think we are happy with where we are.”
Fitbit still has a rough road ahead of itself for the remaining period of 2017. There likely will not be any great surprises with regards to revenues although earnings may prove greater than anticipated should the company execute on its offered restructuring and streamlining of operations. This is the typical cycle for a hardware-centric company, even as they begin to employ other sales generating offerings. Having said that, earnings will not hold investor sentiment above actual sales proliferation and as such the share price will continue to wax and wane for the greater part of 2017. Now on to that widely suspected, anticipated and scrutinized Fitbit smartwatch.
I’ve been a heralded critique of the smartwatch category since inception or rather commencement of sales for such devices. In short, the device is much like an iPad or Tablet in that it fits in between specific technological hardware applications. The Tablet fits in-between a laptop and smartphone while a smartwatch fit’s in-between a smartphone and a fitness tracker. It’s this in-between ground that finds smartwatches to have little utility and naturally or to be expected very few unit sales. When compared to fitness tracker sales over the last 3 years, smartwatches sell far fewer units than fitness trackers with fitness trackers outselling smartwatches by a ratio of almost 4:1 and as reported by IDC since 2014. Will that sales ratio change? It depends on your perspective as a great many variables are presently in play that are masking the true sales results for both the smartwatch and fitness tracker sub-category sales. The broader category sales are known as wearables.
Most recently, Strategy Analytics released its Wearables segment sales findings. Within the results it found that Apple had overtaken Fitbit as the global leader in wearable devices.
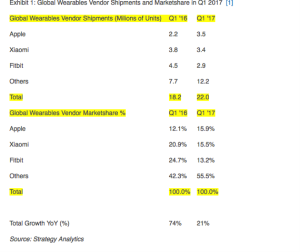
The key takeaways from Strategy Analytics reporting I will aptly characterize as misleading and erroneous in its projection. For new readers of my analytics, keep in mind that in early 2016 I offered to investors and analysts alike that IDC and all reporting wearables agencies would find themselves revising their forecast down. Naturally, this has been exactly what reporting agencies have done as the initial excitement of the category has been found to be little more than another hardware-centric category that once saturation is found, sales decline. Every single quarter, IDC has lowered its estimates out to 2020. This trend will likely continue until true demand and maturation of the wearables category is found. So having said all of that, the data offered by Strategy Analytics, on the surface, is inarguable. Apple Inc. (AAPL) has sold more devices YOY and more devices than that of Xiaomi and Fitbit. Having said that, let’s take a more substantive view of the data, by analyzing the true trend for smartwatches and what has elevated Apple to a leading position in the wearables category.
In 2016 I offered that the Apple Watch Series 1 was an absolute failure. Sales were terrible and Apple was forced to lower its average selling price for the device nearly a year before launching its next iteration. Apple Series 2 launched in the fall of 2016 and when I offer to readers/investors that the sales have not improved, understand that I receive the actual sell through of these devices from a vast selection of U.S. retailers. I offered such retail sales reporting on the Apple Watch last year in an article titled Apple Watch Price Reduction Highlights Sell-Through Issues. Within the article I offered actual AWS sales results from Apple’s leading U.S. retail partner as follows:
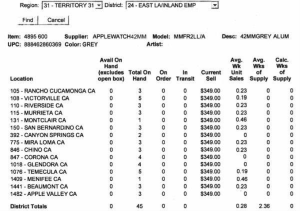
Back then, the average selling price at the retailer was $349 per AWS unit and for which few sales were garnered. Today the AWS1 sells for $269 a unit while the second-generation device sells for $369 per unit. I should rather offer that the units don’t sell very well at $369 despite what Strategy Analytics has offered. What readers/investors should better understand is that Apple has once again benefited from its brand power and convinced retailers that THIS version of the AWS will sell. Why? Well because we’ve restyled, added waterproofing and refined the definition of using the device to be more inline with health & fitness activities. So what did the retailers do? Of course, it’s Apple after all, so they bought into the device. Unfortunately, now the retailers are stuck with yet another AWS device that isn’t selling well. “But the data from Strategy Analytics shows a sharp increase in sales YOY Seth”? I’m aware and I don’t disagree with what the data shows. What I’m detailing is the abysmal sales trends: The actual sell-through from the retailer to the consumer because that is all that mattes long-term. It’s the problem that has found its way to Fitbit’s doorstep after years of increasing skus and sell-in and will find its way AGAIN to Apple’s doorstep. Don’t forget, Apple’s AWS1, post product launch did nothing but exhibit sequential quarterly sales declines. That is exactly what the AWS2 is expressing after it launched in the fall and through the holiday sales period.
|
Top Five Wearable Device Vendors, Shipments, Market Share and Year-Over-Year Growth, 4Q 2016 (Units in Millions) |
|||||
|
Vendor |
4Q16 Unit Shipments |
4Q16 Market Share |
4Q15 Unit Shipments |
4Q15 Market Share |
Year-Over-Year Growth |
|
1. Fitbit* |
6.5 |
19.2% |
8.4 |
29.0% |
-22.7% |
|
2. Xiaomi |
5.2 |
15.2% |
2.6 |
9.1% |
96.2% |
|
3. Apple |
4.6 |
13.6% |
4.1 |
14.1% |
13.0% |
|
4. Garmin |
2.1 |
6.2% |
2.2 |
7.6% |
-4.0% |
|
5. Samsung |
1.9 |
5.6% |
1.4 |
4.7% |
37.9% |
|
Others |
13.6 |
40.1% |
10.3 |
35.5% |
32.1% |
|
Total |
33.9 |
100.0% |
29.0 |
100.0% |
16.9% |
|
Source: IDC Worldwide Quarterly Wearable Device Tracker, March 2, 2017 |
|||||
The table above is from IDC’s global wearable device tracking report for units sold during the Q4 2016 period, which is Apple’s Q1 2017 period. As reported, Apple sold 4.6mm wearable devices during the period, how many were actual AWS1 & 2 devices and how many were Air Pods is indeterminate. But let’s go with the assumption that all units were AWS1 & 2 units. As reported by IDC, Apple would have sold 4.6mm units during the all-important holiday period to its retail and distribution partners around the world. Following the holiday period is the most critical replenishment period for retailers and distributors, as they desire not to have a lack of inventory after the holiday period. Shelves must remain full and demand from consumers must be met within forecast. It is within this consideration, that the data from Strategy Analytics is quite alarming. Well, not to me as I expected a sequential decline because the actual sell-through of AWS1 & 2 was quite poor. But as one can see, the critical replenishment period found a sequential decline for AWS1 & 2 sales, going from 4.6mm units down to 3.5mm units, a decline of greater than 25% sequentially. This shows that retailers still had ample inventory of AWS devices in stock past the holiday sales period and thus, they ordered fewer units. While still above what Xiaomi and Fitbit had sold respectively, far fewer than they had sold into the holiday period. Additionally, I would have also expected Apple to have expanded the distribution of AWS2 during the Q1 period. Layering that factor into the equation forces one to recognize that even with advanced distribution, the AWS sales couldn't keep pace with Q4 2016 sales. This is the exact same trend that foretold the demise for the original AWS smartwatch. Furthermore, this is exactly why when Apple reported its so-called greatest holiday sales for the AWS it never discussed the average selling price for the AWS or the actual sell-through to consumers. Select retailers were offering the AWS1 for door busters at a price of $199 during the Q4 2016 holiday period.
Plainly and most simply, Apple did nothing more than increase its wearable sku count on a YOY basis to achieve its leading status in the wearables category. Where they only had one device in 2015, they had 2 devices in 2016 and now 3 devices in 2017 with the inclusion of Air Pods. It’s why on a YOY basis, the “Others” category sales grew during Apple’s reported Q2 2017 period by 31% with the tripling of its wearable sku count, but declined 29% sequentially from Q1 to Q2 2017. (Apple Watch is the greatest sales contributor to Others category sales) Just like the iPad, post any new product launch, the AWS and wearables product line do nothing but show declining sales. The AWS2 will likely, as is already being demonstrated in the sequential quarterly results, prove to sell as poorly as AWS1. Even more plainly and simply put, the smartwatch is a great idea in concept, but offers little to advantage itself from its predecessor smartphone platform. That’s not just me suggesting as such, but the black and white sales statistics for these devices.
Smartwatches have a grave disadvantage to the smartphone and even the fitness tracker. When we review very accessible sales data from one of the absolute largest retailers on the planet, Amazon (AMZN), this is no more aptly displayed. Even with a lesser smartwatch platform by Fitbit in its Blaze smart fitness watch, the device is the best selling in the smartwatch category of Amazon sales. It has remained as such since the product launched. Having said that, Blaze has continued its sales declines since the product launched, as the price point is found undesirable with regards to its utility. This is also why the Blaze price point has moderated lower from $199-$149 most recently. Most of these devices are used for the basic principles of health & fitness tracking and as such, the greater alignment of utility and price finds the greatest sales to the consumer/sell-through. Amazon.com is the greatest of real-time sales results available to the public. Apple Watch Series 2 barely holds on to a top 10 ranking in the smartwatch category on Amazon and one can recognize rather quickly why it ranks below the likes of Garmin (GRMN) Samsung and Fitbit. The Apple Watch Series 2 has the highest price point of the 4 brands. The utility simply doesn’t warrant the higher price point based on consumer demand.
Last, but not least as it pertains to identifying factual and relevant sell-through trends are downloads. Be it on Google Play or the iOS App Store itself, Fitbit remains the most downloaded health & fitness app. It is hard to ignore such a relevant, real-time data point as an inference into true market share and daily usage of wearable devices.
So now that I can jump off my data and analytics soap box for a moment, let’s take a look at what Fitbit is offering for tis Q2 2017 period.
We expect revenue for the second quarter to be in the range of $330 million to $350 million. We expect a net loss per share of $0.17 to $0.14. Similar to Q1, we expect our tax rate to be approximately 43%. We expect to build both inventory and accounts receivables in the quarter, placing downward pressure on free cash flow. Despite a projected cash burn, we believe our robust balance sheet provides ample flexibility to invest in the business organically and inorganically to innovate and grow. We expect revenue in the range of $1.5 billion to $1.7 billion, non-GAAP loss per share in the range of $0.44 to $0.22 and negative free cash flow in the range of $100 million to $50 million. Given an expected increase in working capital needs, we expect free cash flow to trend towards the lower end of our range.
I would expect the cash burn to be modestly above what is being offered and I believe from an investor standpoint this is a prudent perspective. If Fitbit is to gain any meaningful ground in the smartwatch sub-category it will need to get off to a rapid sales start not just on the shelf but into the consumer’s hands. Regardless of the most recently reported metric results offered by Fitbit, the critical objective for the firm going forward is to successfully reduce inventories in the sales channel while executing successful product launches that align with consumer interests. An investor's takeaway suggests a better opportunity to acquire shares of FIT will be found below $6 a share.
Disclosure: I am long FIT


