
Trucking Data Improves In January 2017
Truck shipments improved in January. Trucking data, like rail, may say the worst is over.

Analyst Opinion of Truck Transport
I tend to put heavier weight on the CASS index which shows a moderate improvement year-over-year. The ATA data continues to wander all over the map - and is likely a result of seasonal adjustment issues.
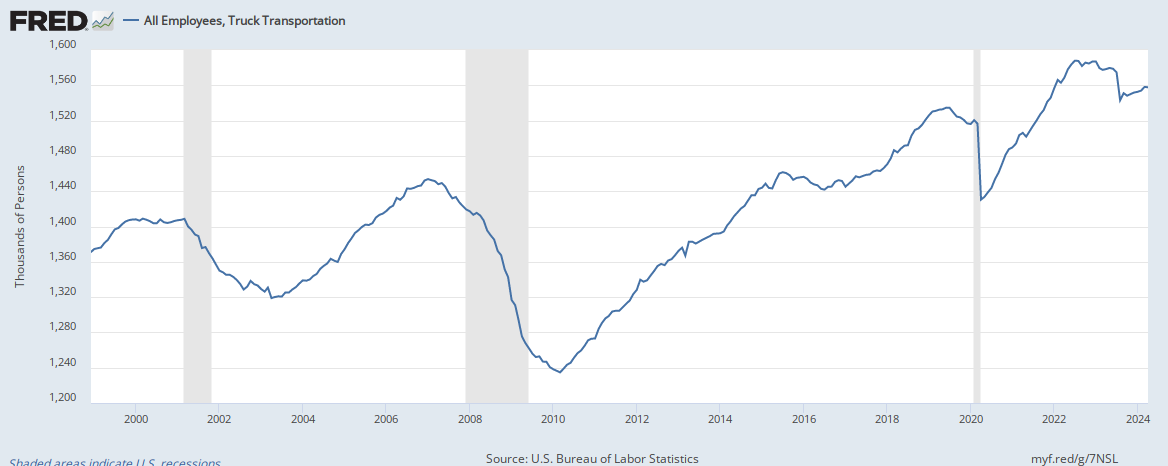
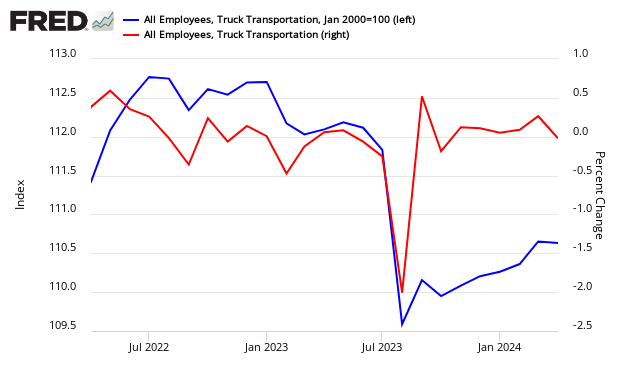
It is also interesting that the current trucking employment pattern remains showing little growth.
(Click on image to enlarge)
ATA Trucking
The American Trucking Associations' (ATA) trucking index rose 2.9% in January, following a 4.3% decrease during December (originally released as a 6.2 % decrease).
From ATA Chief Economist Bob Costello:
The freight economy is starting to show some signs of life and January's truck tonnage numbers are a good step forward. Hopefully the ups and downs in truck tonnage during 2016 will not be as pronounced in 2017.
Looking ahead, the most recent positive sign for truck tonnage is the large drop in the inventory-to-sales ratio during December. The decrease putinventories throughout the supply chain, relative to sales, to the lowest level in two years. There is no doubt that the inventory glut was a drag on truck freight volumes last year,
Truck tonnage this month
(Click on image to enlarge)

z truck.jpg
Compared with one year ago, seasonally adjusted tonnage increased 2.6 %.
Econintersect tries to validate ATA truck data across data sources. It appears this month that jobs growth says the trucking industry employment levels were down month-over-month - but insignificantly. Please note using BLS employment data in real time is risky, as their data is normally backward adjusted (sometimes significantly).
(Click on image to enlarge)
This data series is not transparent and therefore cannot be relied on. Please note that the ATA does not release an unadjusted data series (although they report the unadjusted value each month - but do not report revisions to this data) where Econintersect can make an independent evaluation. The data is apparently subject to significant backward revision. Not all trucking companies are members of the ATA, and therefore it is unknown if this data is a representative sampling of the trucking industry.
source: ATA
FTR's Trucking Conditions Index for December Shows Decline Ahead of Bounce Expected in 2017
FTR's Trucking Conditions Index (TCI) for December declined from November to a reading of 2.9 reflecting soft conditions that have plagued the industry, especially in the second half of 2016. The January index will likely hit a nadir ahead of a hoped-for bounce in 2017. As detailed in the February issue of the Truckers Update, FTR is confident that trucking conditions are nearing an inflection point toward the positive, with a steady increase in capacity utilization that will tighten prices as we move further into the new year.
(Click on image to enlarge)
source: http://www.ftrintel.com/news/latest-tci/index.php
CASS FREIGHT INDEX REPORT
Both the Shipments and the Expenditures Indexes have now turned positive. Throughout the U.S. economy, there is a growing number of data points that suggest that the worst is over and the economy is getting better. Some data points are simply less bad, but an increasing number of them are better, and even a few are becoming outright strong. The 3.2% increase in the January Cass Shipments Index is yet another data point which strongly suggests that the first positive indication in October may have indeed been a change in trend. In fact, it now looks as if the October index, which broke a string of 20 months in negative territory, was one of the first indications that a recovery in freight had begun in earnest. Data is suggesting that the consumer is finally starting to spend a little, and that with the surge in the price of crude (back above $50 in October), the industrial economy's rate of deceleration first eased and then began a modest improvement led by the fracking of DUCs (drilled but uncompleted wells), especially in the fields with a lower marginal production cost (i.e., Permian and Eagle Ford). How fast will the recovery be from here? That is yet to be seen. However, the overall freight recession which began in March 2015 appears to be over.
(Click on image to enlarge)

Source: http://www.cassinfo.com/Transportation-Expense-Management/Supply-Chain-Analysis/Cass-Freight-Index.aspx
Disclosure: None.


According to the historical patterns in the ATA chart, it appears that going forward the number of employees will be decreasing. However this cyclical movement is just a reflection of economic prosperity. Since trucking is such a vital behind-the-scenes industry we don't give it much attention. Unfortunately, none of the data represent growth trends, rather a period of contraction which is consistent with the US Economy. The irregular patterns in the data do not provide the market with enough stability.
Great article, Great read!