
The 2016 VIX Futures Term Structure: Extraordinarily Average
Two days ago, in The Year in VIX and Volatility (2016), I made no mention whatsoever of the VIX futures term structure. Traders of the full range of VIX products (futures, options and ETPs) hopefully know by now that the entire VIX product landscape is based -- and priced -- off of VIX futures and one of the most important aspects of VIX futures is the shape of the term structure.
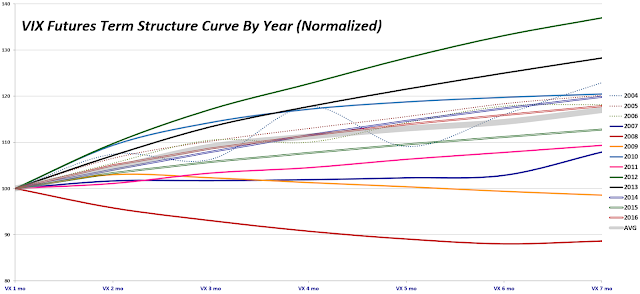
Long story short:as the graphic below shows, the 2016 VIX futures term structure (double red line) was closer to its historical average (wide gray line) than any prior year since the launch of VIX futures in 2004, with the average term structure over the course of the year demonstrating a relatively modest upward sloping term structure, also known as contango.
[source(s) CBOE, VIX and More]
By way of explanation, the graphic above shows the average (mean) normalized term structure for each year since the VIX futures were launched. In normalizing the data, I have set the average front month VIX futures contract to 100 and have expressed the averages of the second through seven months as multiples of the front month. Note that the terms structure lines are dotted and somewhat wavy for 2004 – 2006, due to the fact that the CBOE did not implement a full complement of consecutive monthly futures until October 2006.
In terms of takeaways, since I have not posted this graphic in two years, note that the term structure for 2015 was slightly flatter than average. Looking back a couple more years, note that 2012 and 2013 saw the steepest term structure on record. In the thirteen-year history of VIX futures, only two years saw a downward sloping term structure, also known as backwardation: 2008 and (barely, depending upon how one measures) 2009.
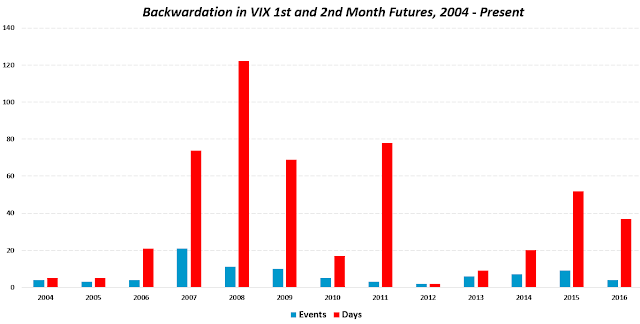
During the course of 2016, the VIX futures term structure moved into backwardation on four separate occasion and closed in backwardation on a total of 37 days – with 31 of those 37 days running consecutively from January 4th to February 16th. These four instances and 37 days are just slightly below the average year, as can be seen in the graphic below.
[source(s) CBOE, VIX and More]
Last but not least, the average term structure for the year as well as the frequency and magnitude of the contango-backwardation dance is a strong determinant of the annual performance of the VIX ETPs and in my next post I will detail why 2016 was unlike the previous year, where Every Single VIX ETP (Long and Short) Lost Money in 2015.
Disclosure(s): the CBOE is an advertiser on VIX and More
Disclaimer: "VIX®" is a trademark of Chicago ...
more


Thanks and Merry Christmas with Happy New Year