
T2108 Update – Surprising Divergence Marks The End Of The August Angst
T2108 Status: 65.4%
T2107 Status: 30.9%
VIX Status: 15.1
General (Short-term) Trading Call: Neutral (target of 1996 on the S&P 500 occurred ahead of overbought conditions. See “From the Edge of A Breakout to the Ledge of A Breakdown” for more details).
Active T2108 periods: Day #11 over 20%, Day #10 over 30%, Day #10 over 40%, Day #8 over 50%, Day #4 over 60% (overperiod), Day #325 under 70%
Reference Charts (click for view of last 6 months from Stockcharts.com):
S&P 500 or SPY
SDS (ProShares UltraShort S&P500)
U.S. Dollar Index (volatility index)
EEM (iShares MSCI Emerging Markets)
VIX (volatility index)
VXX (iPath S&P 500 VIX Short-Term Futures ETN)
EWG (iShares MSCI Germany Index Fund)
CAT (Caterpillar).
IBB (iShares Nasdaq Biotechnology).
Commentary
The S&P 500 (SPY) made a small breakout on Friday, October 16th. With a close of 2033.11, the index sits almost exactly where it sat the day before the first oversold period began during the August angst.
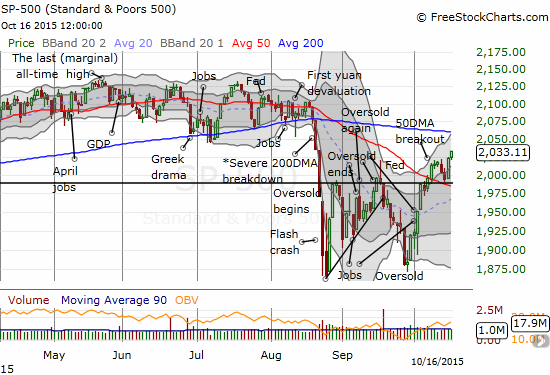
The S&P 500 breaks out ever so slightly to finish a complete reversal of the all the previous oversold periods.
The volatility index, the VIX, reinforces the potential importance of this move. The VIX gapped down right above the 15.35 pivot and eventually closed right below it. This move marks and confirms the END of the August angst.
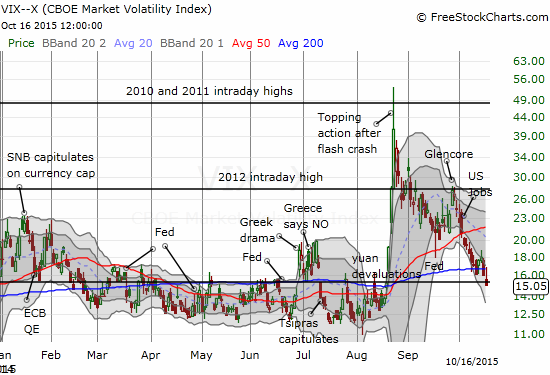
The VIX is back into the “all is well” zone – below the 15.35 pivot line.
The NASDAQ (QQQ) is still lagging as it has not yet broken the intraday high from September. However, it HAS broken through its down trending 50DMA – a bullish sign.
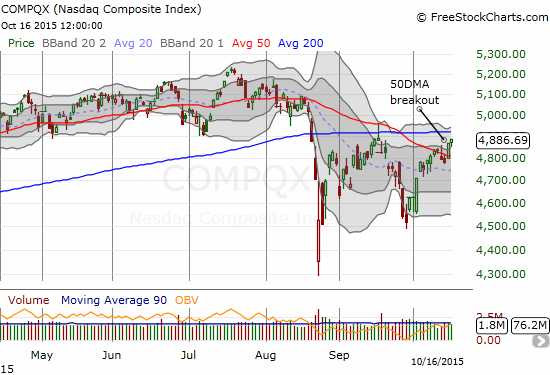
The NASDAQ has confirmed a 50DMA berakout but has yet to make a new (intraday) high in this post oversold period
Despite the good signs, T2108 did not follow the market higher. In fact, I daresay my favorite technical indicator SHOULD have hit overbought territory. Instead, T2108 retreated ever so slightly to 65.4%.
So, overall, the oversold trades have worked out exceptionally well given the complete reversal of the August angst. My remaining position consists of shares of ProShares Short VIX Short-Term Futures (SVXY). Upside potential still exists with a retest by the S&P 500 of its now downtrending 200DMA resistance. Such a test SHOULD occur with T2108 hitting overbought conditions. The current short-term trading call remains neutral, and I anticipate it going to bearish once T2108 flips overbought. HOWEVER, if the S&P 500 manages to confirm a 200DMA breakout, I will quickly revise my trading assessment as needed. Again, I will take this one step at a time. There is still plenty of time on the clock for the third quarter earnings season.
As a final check, here is the Australian dollar (FXA) versus the Japanese yen (FXY). AUD/JPY is still comfortably above its 50DMA. It confirms the bullish bias in the market right now.
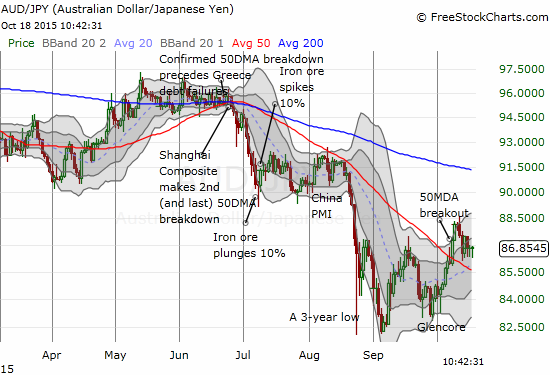
The Australian dollar is still in a bullish position against the Japanese yen for now.
This earnings season, I have taken particular note of stocks that experienced sharp reversals from initial losses. It is a sign that buyers are eagerly looking to buy dips and other similar buying opportunities. Intel (INTC), Goldman Sachs (GS), and Wynn Resorts (WYNN) have experienced these kinds of quick turn-rounds although WYNN could not quite close the gap.

Goldman Sachs (GS) stages an impressive post-earnings reversal even as the overall chart still looks very bearish: 50DMA resistance is holding and the August angst still weighs heavily on the stock.
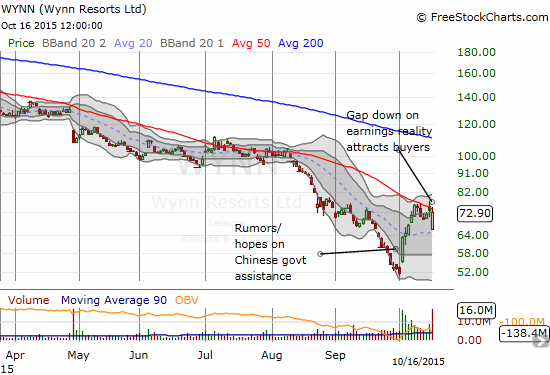
Wynn Resorts (WYNN) bounces sharply off its post-earnings low but fails to hold a complete gap fill. 50DMA resistance still in place. Trading volume still extremely high.
On the other hand, Netflix (NFLX) lost its campaign to return to the bullish status of the tech big cap leaders. Until it can regain its composure above the 50DMA, it is back to a bearish bias for trading the stock.
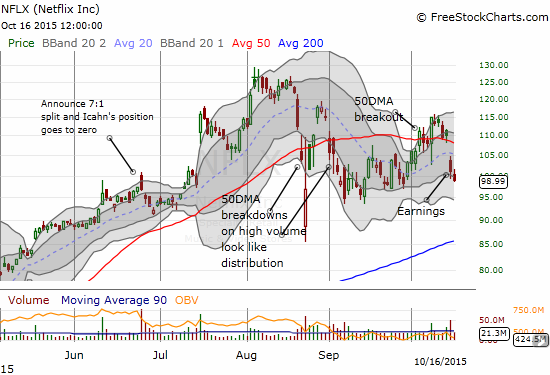
Netflix (NFLX) fails to attract post-earnings buyers as yet.
Daily T2108 vs the S&P 500

Black line: T2108 (measured on the right); Green line: S&P 500 (for comparative purposes)
Red line: T2108 Overbought (70%); Blue line: T2108 Oversold (20%)
Weekly T2108

*All charts created using freestockcharts.com unless otherwise stated
Be careful out there!
Full disclosure: ong SVXY, short WYNN, long WYNN call and put options


