
T2108 Update – From The Edge Of A Breakout To The Ledge Of A Breakdown
T2108 Status: 35.4%
T2107 Status: 25.7%
VIX Status: 21.1
General (Short-term) Trading Call: Bullish
Active T2108 periods: Day #4 over 20%, Day #1 under 30% (underperiod – ended 2 days over 30%), Day #23 under 40%, Day #83 under 50% (correction reduced by a day), Day #100 under 60% (correction reduced by a day), Day #305 under 70% (correction added 6 days)
Reference Charts (click for view of last 6 months from Stockcharts.com):
S&P 500 or SPY
SDS (ProShares UltraShort S&P500)
U.S. Dollar Index (volatility index)
EEM (iShares MSCI Emerging Markets)
VIX (volatility index)
VXX (iPath S&P 500 VIX Short-Term Futures ETN)
EWG (iShares MSCI Germany Index Fund)
CAT (Caterpillar).
Commentary
Friday, September 18, 2015 was a strange day that started as a true head-scratcher.
Very surprising too see $SPY (sell-off) and $AUDJPY (rallying) so far out of sync. Can't last. Betting on #forex as leading indicator.
— Dr. Duru (@DrDuru) September 18, 2015
As it turned out, AUD/JPY eventually weakened a bit. Still, the Australian dollar (FXA) versus Japanese yen (FXY) pair did not turn downward as much as I would have expected given the S&P 500 (SPY) lost a full 1.6% by the end of the day. The NASDAQ (QQQ) also had a very bearish day failing at 50DMA resistance.
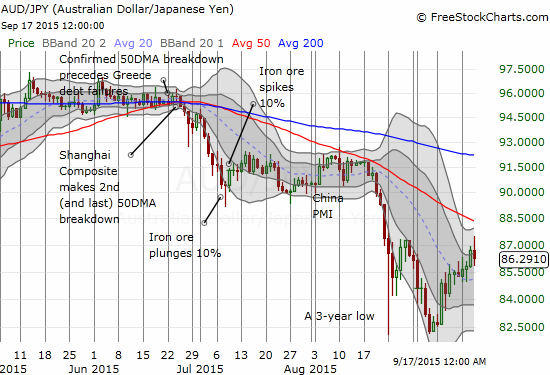
AUD/JPY loses some momentum as it fades in the face of resistance from the previous high
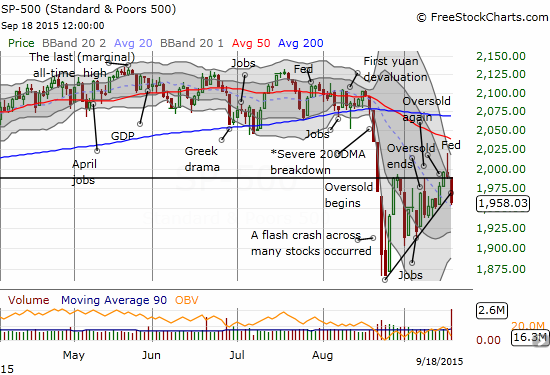
The S&P 500 crashes right through the bottom of the previous wedge pattern. A danger sign with an imminent Bollinger Band squeeze.
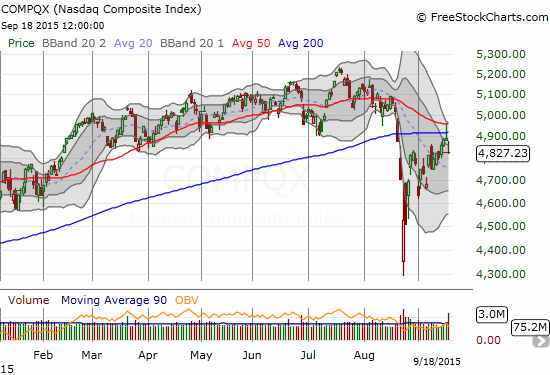
The NASDAQ confirms a rejection from 50DMA resistance
I was clearly premature in declaring on Thursday that the S&P 500 (SPY) was close to a breakout. Now, the S&P 500 is on the ledge of a breakdown as the lower support from the rising wedge gave way today. This was a line I was over-confidently expecting to hold. I even bought a fresh tranche of call options on ProShares Ultra S&P500 (SSO) expecting the down gap to soon fill.
Adding to the strangeness of the day, the volatility index, the VIX, gained a mere 5.4% on the day yet the ProShares Ultra VIX Short-Term Futures (UVXY) soared a whopping 25.2%. I tried to place a fresh trade to fade UVXY with put options at the lower end of the bid/ask range, but they never filled. I have noticed that such failures are often indicators that my intuition is onto something. Unlike similar episodes, I did not press the issue and up my price. I will keep riding my current anti-volatility positions and will look to add on Monday if volatility remains aloft.
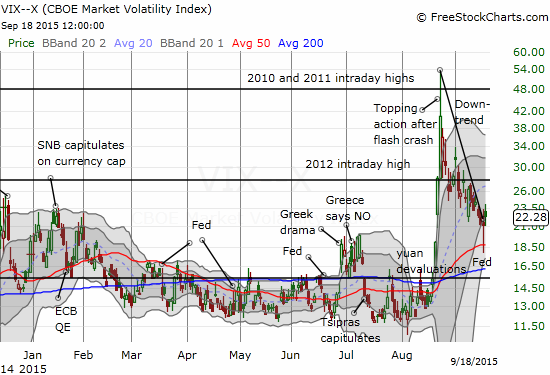
The VIX nudges above the downtrend that defined the entire pre-Fed period.
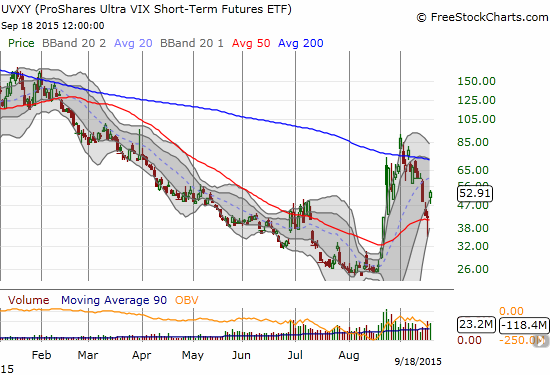
ProShares Ultra VIX Short-Term Futures (UVXY) soars as bears confirm a successful defense of 50DMA support
I am guessing that part of the strangeness of the day had to do with an options expiration right after the Fed meeting. If so, Monday should feature an equally strange/surprising day, perhaps to the upside even. So, while the S&P 500 is now at the ledge of a new breakdown, I am not ready to extrapolate to what would have to be yet another trip to oversold territory.
T2108 dropped below 30% to 27.8%. I have quickly placed expectations for eventual overbought conditions back on the shelf. T2108 is LONG overdue for a return to overbought conditions, but an extended period of chop now seems much more likely in the near term. The 10 months that elapsed between oversold periods was incredible enough. I now marvel over the 305 trading days since T2108 was last overbought. This chart shows that rarity of this period.
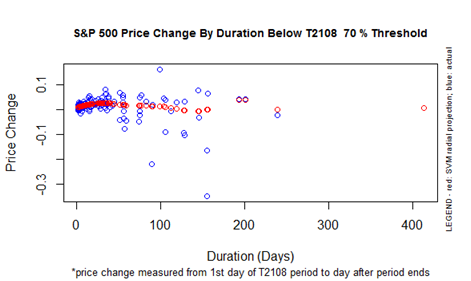
The duration of the current T2108 70% underperiod is exceptionally long compared to the historical record
That’s right. There has only been ONE other period since records were available in 1986 where the market went this long without crossing the 70% threshold. The S&P 500 is up a meager 1% since July 7, 2014 when it last dropped out of overbought conditions. If T2108 entered overbought conditions today, this performance would be roughly in-line with projections such as they are with so few available data points. This projection has one potentially important implication for the S&P 500. When the index finally reaches overbought status again, it might very well trade around CURRENT levels. This projection has me thinking that I should now take profits on my SSO shares accumulated during the previous oversold periods. If my read is correct, I also have affirmation for my expectation for an extended period of chop. Surely then, overhead resistance at the 50 and/or 200DMAs will hold TIGHT when the S&P 500 finally tests them.
These are strange times indeed.
There are some troubling charts to further undermine my previous confident bullishness.
I was remiss in failing to point out the ominous chart of Apple (AAPL) in the last T2108 Update.
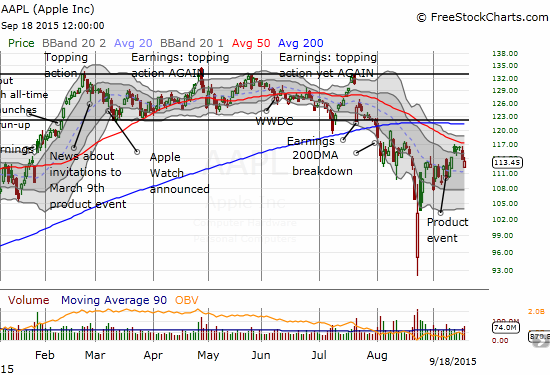
Apple gaps down sharply in a follow-through move confirming the 50DMA as resistance.
AAPL started the week in promising fashion with a modest gap up. However, after three total days churning below 50DMA resistance, it finally sold off on Thursday, the day of Fedageddon. When the market initially rallied off the Fed decision, AAPL only managed to close its gap down for the day before selling off hard into the close. On Friday, AAPL gapped down sharply in a surprisingly strong move given the rest of the market was only mildly down at the time. Buyers immediately stepped in and even flipped AAPL green while the rest of the market was increasing its sell-off. AAPL ended with a marginal loss and went from relative weakness to relative strength. Still, the end result is a stock that remains in a very bearish position with its 50DMA confirmed as strong resistance.
Next up is Caterpillar (CAT). CAT convincingly gapped down and sellers maintained the selling pressure the entire day. While marginal, CAT closed at a fresh 4-year low. This is pretty bearish and suggests CAT is getting ready to resume the downtrend in place ahead of the flash crash. I suddenly feel like I do not own enough put options on CAT as my hedge on bullishness.
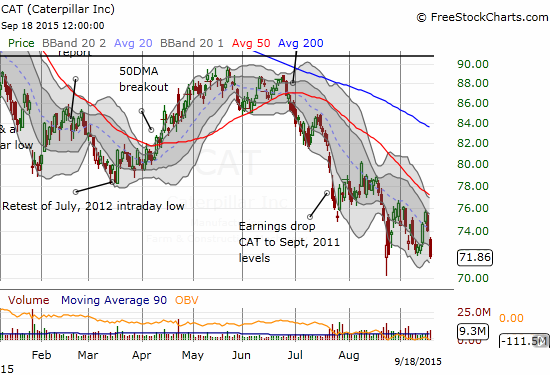
Danger! Caterpillar (CAT) closes (marginally) at a fresh 4-year low.
Daily T2108 vs the S&P 500

Black line: T2108 (measured on the right); Green line: S&P 500 (for comparative purposes)
Red line: T2108 Overbought (70%); Blue line: T2108 Oversold (20%)
Weekly T2108

*All charts created using freestockcharts.com unless otherwise stated
The charts above are the my LATEST updates independent of the date of this given T2108 post. For my latest T2108 post click here.
Be careful out there!
Full disclosure: long SVXY shares, long SSO shares, long CAT puts, short AUD/JPY, long AAPL put spread


have to use you as a contrary indicator
What is the pattern you have observed to suggest contrarianism is the way to go with the T2108 Update?
Nicely done.
Thanks for the kudos.