
T2108 Update – Ending The August Angst With An Exclamation Point
T2108 Status: 64.9%
T2107 Status: 31.7%
VIX Status: 15.0
General (Short-term) Trading Call: Neutral (target of 1996 on the S&P 500 occurred ahead of overbought conditions. See “From the Edge of A Breakout to the Ledge of A Breakdown” for more details).
Active T2108 periods: Day #12 over 20%, Day #11 over 30%, Day #11 over 40%, Day #9 over 50%, Day #5 over 60% (overperiod), Day #326 under 70%
Reference Charts (click for view of last 6 months from Stockcharts.com):
S&P 500 or SPY
SDS (ProShares UltraShort S&P500)
U.S. Dollar Index (volatility index)
EEM (iShares MSCI Emerging Markets)
VIX (volatility index)
VXX (iPath S&P 500 VIX Short-Term Futures ETN)
EWG (iShares MSCI Germany Index Fund)
CAT (Caterpillar).
IBB (iShares Nasdaq Biotechnology).
Commentary
Not a lot of action today: the S&P 500 (SPY) and T2108 were essentially flat on the day. However, for my last T2108 oversold trade, it was a big day.
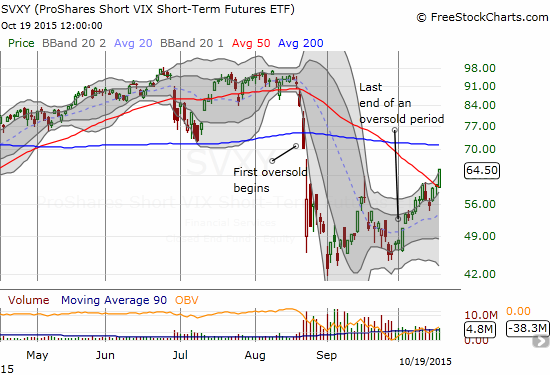
The ProShares Short VIX Short-Term Futures (SVXY) finally breaks out above its 50DMA and closes at its highest point since the oversold periods began.
This 7.2% gain was a sneaky move because the volatility index, the VIX, barely budged on the day. I will probably sell my SVXY shares this week.
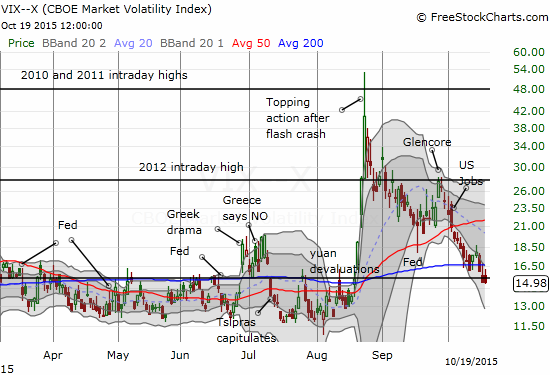
The volatility index seems setup to trend all the way back to recent lows.
On the flip side, the ProShares Ultra VIX Short-Term Futures (UVXY) has ended the August Angst with an exclamation point. UVXY has now completely reversed its entire run-up from late August. UVXY is also likely to get back to familiar territory: all downhill.
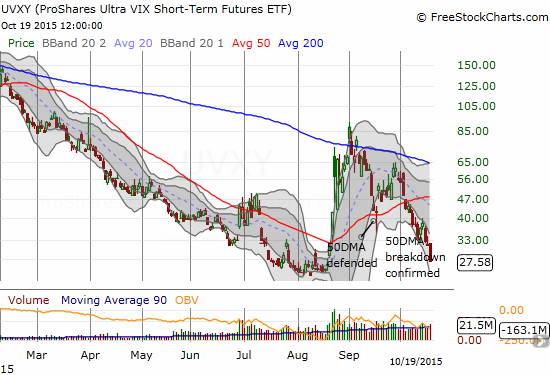
ProShares Ultra VIX Short-Term Futures (UVXY) looks set to resume its downtrend as the August Angst ends with an exclamation point.
In the last T2108 Update, I completely forgot to note the growing buying interest in iShares Nasdaq Biotechnology (IBB).
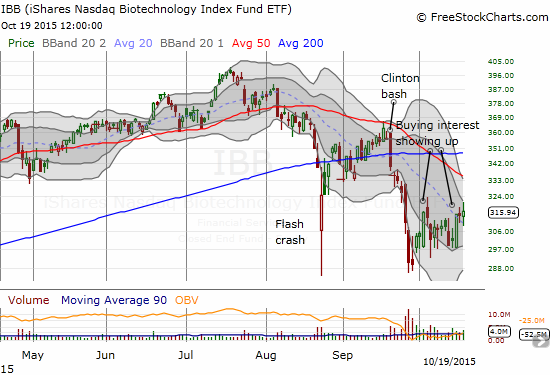
iShares Nasdaq Biotechnology (IBB) showing some signs of life off the recent lows.
I know IBB is LONG overdue to make a run at reversing the Clinton bash, but the appearance of buying interest as shown above is a reminder to keep the eyes on the ball here.
Speaking of keeping eyes on the ball, I almost missed this unfolding breakout on Baidu (BIDU)…
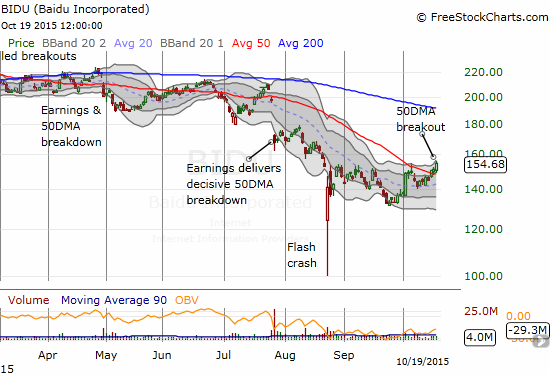
Baidu (BIDU) is finally making a move for a bullish pastures.
I am SO tempted to get back into BIDU. Trading volume is picking up on the buying. However, earnings are coming next week. So, if I do make a move it will strictly be a pre-earnings trade. I will definitely be looking for an excuse from earnings to make a longer-range play.
My favorite story of the day was Weight Watchers (WTW) I remember when Jennifer Hudson’s commercials made a big splash in early 2011. The stock surged. That was the LAST time things looked good for WTW. The stock maxed out about $87 that year. WTW looked ready for the ICU for over-dieting under $4 back in July. Today, it was a full course meal as WTW increased a whopping 105%.
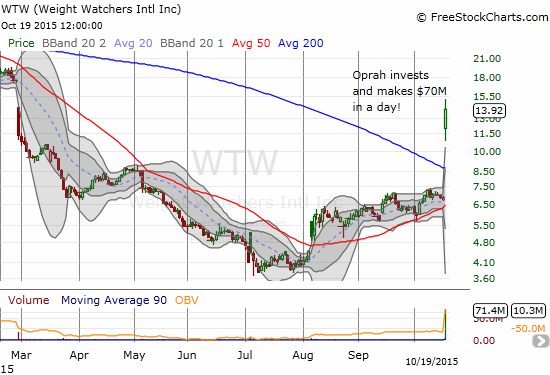
Weight Watchers puts on some (good) weight finally as Oprah weighs in.
Short interest was an insanely high 74% of float as of September 30th. Talk about greedy shorts. Surely, they had kicked up their feet and planned to just wait for WTW to die a slow but inevitable death. Oprah’s purchase of 10% of the company changed the risk/reward balance on short positions. If nothing else, the stock has printed a low that should be sustained for a good while.
The rush to cover must help explain the extreme nature of this move on the news. It has taken me YEARS, but I have finally learned to welcome, not fear, such moves for quick trades. This was NOT a time for fading. So when I saw WTW fading right from the open I made an initial buy fully prepared to make another. I never got another chance. Almost 20% later I locked in my profits.
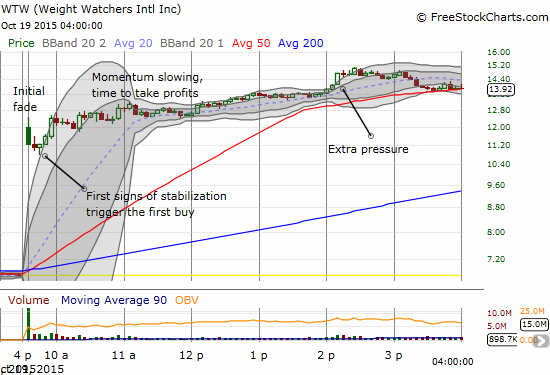
This 5-minute chart, shows the intraday buying opportunities on Weight Watchers (WTW) post-Oprah
WTW underlined the exclamation point that marked the end of the August Angst.
Daily T2108 vs the S&P 500

Black line: T2108 (measured on the right); Green line: S&P 500 (for comparative purposes)
Red line: T2108 Overbought (70%); Blue line: T2108 Oversold (20%)
Weekly T2108

*All charts created using freestockcharts.com unless otherwise stated
Be careful out there!
Full disclosure: long SVXY, short WYNN, long WYNN call and put options


