
T2108 Update – A Second Epic Oversold Period Over The Past Five Months
(T2108 measures the percentage of stocks trading above their respective 40-day moving averages [DMAs]. It helps to identify extremes in market sentiment that are likely to reverse. To learn more about it, see my T2108 Resource Page. You can follow real-time T2108 commentary on twitter using the #T2108 hashtag. T2108-related trades and other trades are occasionally posted on twitter using the #120trade hashtag. T2107 measures the percentage of stocks trading above their respective 200DMAs)
T2108 Status: 7.4% (as low as 3.8%!!! A 7+ year low! Only 27 trading days since 1986 have closed lower than 3.8%).
T2107 Status: 12.1% (a fresh near 7-year closing low. Was as low as 9.0%, a level last seen March, 2009)
VIX Status: 27.6 (faded from a high of the day at 32.1 to close right on the 2012 intraday high)
General (Short-term) Trading Call: bullish
Active T2108 periods: Day #9 under 20%, Day #12 under 30%, Day #28 under 40%, Day #32 below 50%, Day #47 under 60%, Day #388 under 70%
Commentary
$SPY is in extremely historic territory now => %stocks>40DMA=5.1%! %stocks>200DMA=10.4%. #T2108 #T2107 Close enuff to "freefall"
— Dr. Duru (@DrDuru) January 20, 2016
At the time I posted this exclamation, I thought the market HAD to be near a bottom for the day. I could not see how this freefall could continue without a corresponding extreme move in the Japanese yen (FXY). Earlier in the day I observed a yen that looked very reluctant to continue to agree with the market’s panic…
Deepening selling of equities out of sync with flat/weakening yen. Could be bullish divergence here. $SPY $USDJPY $AUDJPY $GBPJPY #forex
— Dr. Duru (@DrDuru) January 20, 2016
As it turned out, T2108 and the S&P 500 (SPY) did manage to drop even lower before staging a massive comeback. T2108 bounced back from a low of 3.8% to close at 7.4%. The low was a 7+ year low. Only 27 trading days since 1986 have closed lower than 3.8%; all these days were associated with the 1987 crash and the 2008 half of the financial crisis. T2107, the percentage of stocks trading above their respective 200DMAs, traded as low as 9.0% before closing at 12.1%. March, 2009 was the last time T2107 dropped as low as it did today. T2107 closed at a fresh 7-year low. Amid the carnage, the S&P 500 dropped as low as 1812 for a whopping 4.0% loss. This intraday low was last seen in April, 2014, almost two years ago. The index closed just under the lows of the August Angst of 2015 and a fresh 15-month low.
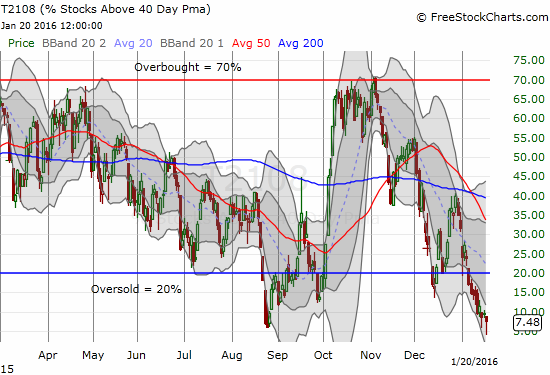
T2108 plunges to new historic levels before bouncing back sharply.
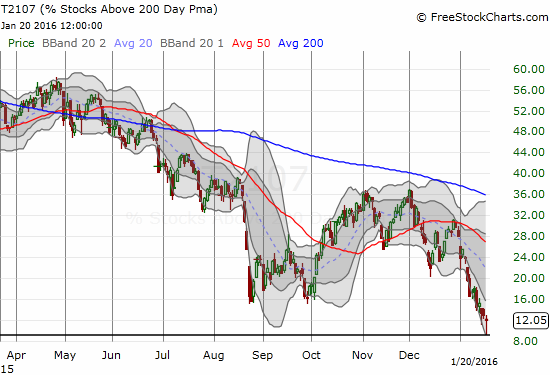
T2107 also plunges deeply before making a sharp comeback.
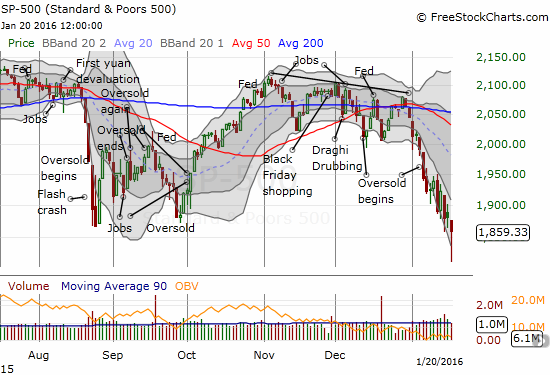
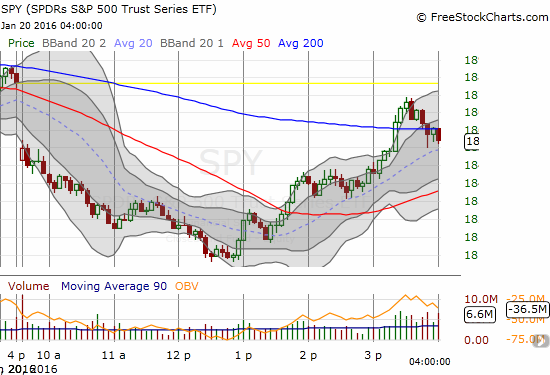
The S&P 500 continues neatly slipping down the channel formed by the lower-Bollinger Bands (BB). The big intraday comeback looks like a bottoming hammer – awaiting confirmation from a follow-through day of buying.
T2108 has a lot of volatility so it is hard to show a long-term chart. The long-term chart of T2107 is a powerful reminder of the duration of the market’s overall deteriorating technical health even after years of rallying. The good news is that there is a LOT of potential upside available for the next sustained relief rally. The bad news is that the severity of these oversold periods since August suggests that the downward momentum for T2107 is likely to pick up pace…
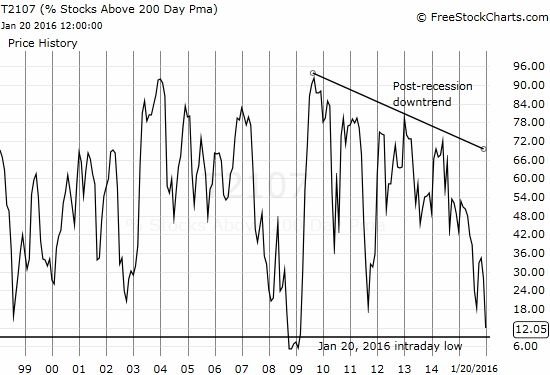
T2107 has been under a long-term downtrend since the first bounce from the financial crisis. Starting in late 2014, the percentage of stocks trading above their 200DMAs failed to regain any upward momentum.
The T2108 oversold period is now 9 days old. Another day closing in single digits extends the projected total duration to a gut-wrenching 20 days. As a reminder, this oversold period has already stretched into rarefied air. A 20-day long oversold period would be absolutely historic.
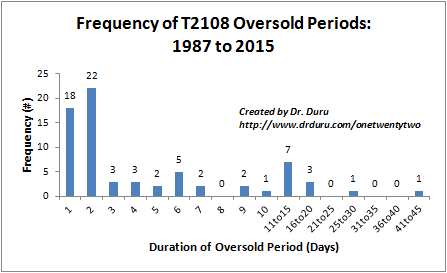
This frequency (distribution) chart for oversold duration shows that over half of oversold periods last just one or two days.
The bounceback was encouraging to see. It created “hammer” candlestick patterns on numerous charts. This pattern creates yet another line in the sand. If the lows hold, I will be relatively confident the lows will continue to hold as support for some time. If they give way, I will assume the market will have to slog through another wave of panic and selling. Interestingly, the intraday trading was not particularly dramatic; that is, no sudden swooshes downward or sudden surges upward. Here is a 5-minute intraday chart of the S&P 500:
After the opening gap down, there was just one 5-minute block with sudden surge in trading activity. This happened near the close and was mostly reversed by the close.
Perhaps the steady flow of trading explains the early “reluctance” of the volatility index, the VIX, to spike extremely high. Given the depth of the overall selling, I would have expected the VIX to soar well above its upper-Bollinger Band (BB). Instead, the VIX did not punch through the upper-BB until lunchtime (Eastern). After THAT, the action moved quickly. The VIX rushed just above 32 and just as quickly dipped back below its upper-BB. It was as if once traders turned their attention to lunctime relief, the market went wild (relative to volatility). The 5-minute chart below the daily chart shows how neatly the VIX peaked and then was quickly suppressed right after the end of the lunchtime “bell” at 1pm.
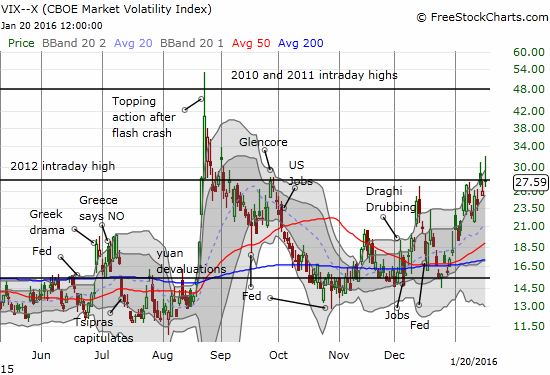
The volatility index, the VIX, is STILL having trouble staying above the intraday high from 2012.
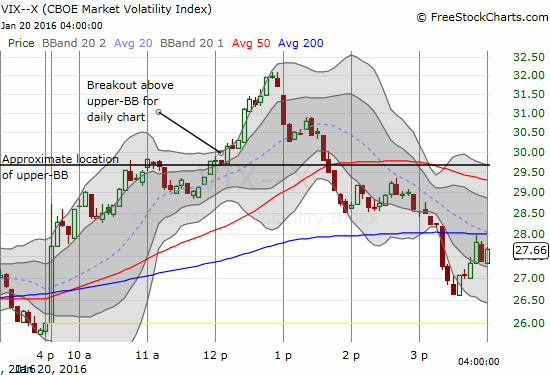
The 5-minute chart shows how the lunch hour (on the East Coast of the U.S.) was a pivotal moment for volatility’s breakout above its upper-BB and then subsequent collapse.
I REALLY want to believe that the VIX’s on-going failure to sustain itself above the intraday high from 2012 is sign that firm resistance is building at that level. Such resistance would add more credence to the formation of a bottom.
Once again, there is a tremendous stack of charts I could show to demonstrate the severity of the trading action today. For this post, I will zero in on Netflix (NFLX). I am sure some readers may have wondered why in the last T2108 Update I could not be certain NFLX could hold onto support at its 200DMA even after getting a 7%+ pop in after-hours post-earnings trading. The daily chart says it all.
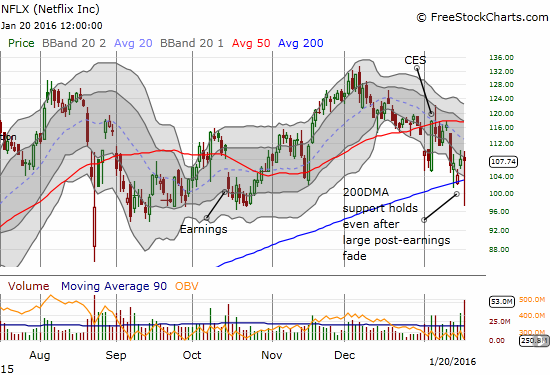
Netflix (NFLX) fades hard from an initial positive post-earnings reaction. After steep plunge below 200DMA support and the lower-BB, buyers step back in and reverse almost all the selling.
From high to low, NFLX swung 13 points. This manic behavior mimicked the swings in the market but on turbo-boost. I would love to extrapolate to the prospects of the general market, but the action was too unstable and volatile. The ability for the 200DMA to emerge victorious is definitely a positive. NFLX will not be out the woods until it can make a decisive breakout above the current downward trending channel – a broad swath of stocks are stuck in similar channels, some more vicious and persistent than others.
In the last T2108 Update, I noted that I was content to wait for the VIX to surge well above its upper-BB before making any further trades. I decided today’s move qualified. Here is a summary of my actions to demonstrate my thinking. Every trade except the NFLX one happened after the volatility index began penetrating above its upper-BB. The last few trades were made closer to the end of trading.
- Bought a single NFLX call option in anticipation of a bounce. I set what I thought was a “lowball” offer, but the value shrank by 75% before making a full recovery on the manic trading action. I was tempted to double down at the lows, but I failed to pull the trigger given the 200DMA breakdown.
- Unlike NFLX, I DID double down on my Workday (WDAY) call options after the stock plunged below its lower-BB.
- Covered my short ProShares Ultra VIX Short-Term Futures (UVXY) put option and locked in profits. It was not supposed to be such a quick hedge, but it made no sense to hold it through the exact moment I was anticipating a peak in volatility.
- Loaded up on iShares Nasdaq Biotechnology (IBB) weekly options and doubled down toward the end of the trading day. This position is strictly for speculative juice. I will need IBB to maintain today’s momentum.
- Bought back into FXCM, Inc. (FXCM) shares as the stock is trying to hold onto 50DM support despite breaking 200DMA support the previous day. See below for chart.
- Bought back my Wal-Mart Stores (WMT) call option as the stock dips down to retest 50DMA support.
- Doubled down on a long-term call option on Disney (DIS). I cannot believe how “cheap” Disney is now. I hope to cover this trade in another post someday soon.
- Low-ball orders to buy more UVXY put options and SVXY shares went unfilled. I will add more ProShares Ultra S&P500 (SSO) call options and/or shares on the next volatility surge.
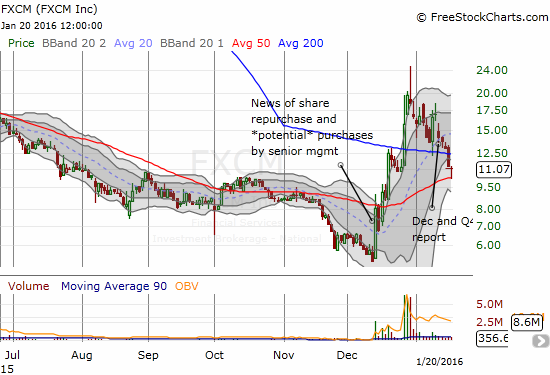
FXCM is cooling off after a ht December. The 50DMA coincides with a critical line of support formed by brief consolidation in December.
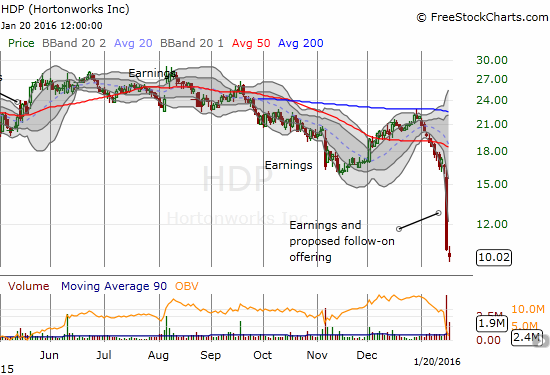
Hortonworks, Inc (HDP) gets completely punished. I bought in anticipation of a renege on the planned share offering from selling insiders – I suspect they were expecting much better pricing…!
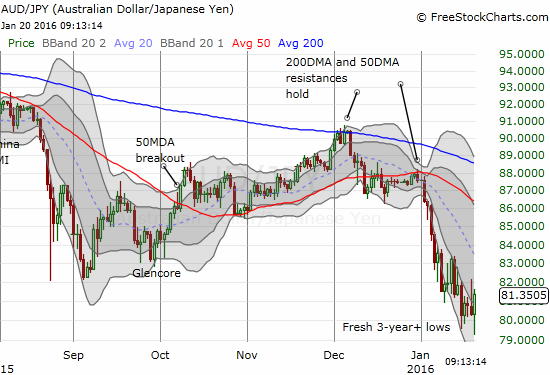
After a brief blip, AUD/JPY managed to hold its lows and help signal that the day’s selling in the stock market was way overdone.
Daily T2108 vs the S&P 500

Black line: T2108 (measured on the right); Green line: S&P 500 (for comparative purposes)
Red line: T2108 Overbought (70%); Blue line: T2108 Oversold (20%)
Weekly T2108

Disclosure: Long SVXY shares, long and short UVXY put options, long SSO call options, long SSO shares, long IBB call ...
more

