
T2108 Update – A Perfect Pause For The S&P 500
T2108 Status: 45.5%
T2107 Status: 45.6%
VIX Status: 17.6
General (Short-term) Trading Call: Hold
Active T2108 periods: Day #57 over 20%, Day #16 above 30%, Day #3 above 40% (overperiod), Day #7 under 50%, Day #25 under 60%, Day #127 under 70%
Reference Charts (click for view of last 6 months from Stockcharts.com):
S&P 500 or SPY
SDS (ProShares UltraShort S&P500)
U.S. Dollar Index (volatility index)
EEM (iShares MSCI Emerging Markets)
VIX (volatility index)
VXX (iPath S&P 500 VIX Short-Term Futures ETN)
EWG (iShares MSCI Germany Index Fund)
CAT (Caterpillar).
Commentary
As I so often say, you just cannot make this stuff up. The S&P 500 pulled back from Thursday’s breakout move to rest perfectly on top of its 50-day moving average (DMA).
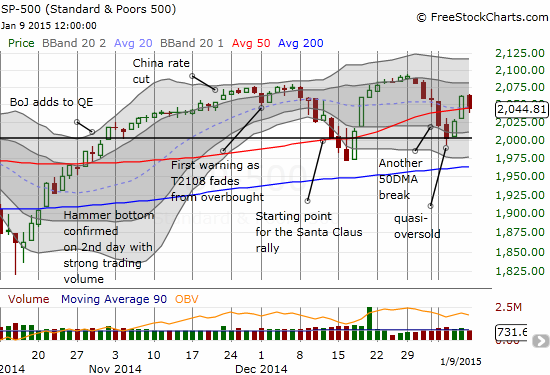
The S&P 500 comes to a perfect rest on top of its 50DMA
This sets up a great buying point for bulls. The HUGE caveat is that another earnings season is upon us, and the market is now subject to more headline “risk” than usual. T2108 remains in essentially a neutral position at 45.5% and cannot help us decide whether to expect a bullish or bearish period ahead.
One interesting thing to note: the 70% underperiod is now at 127 days and has become exceptionally long relative to history. Granted, one could argue that T2108 “essentially” hit overbought on November 26th at 69.99%. However, sticking to the strict definition, the chart below suggests that the range of potential performances for the S&P 500 by the time it returns to overbought territory has become very wide.
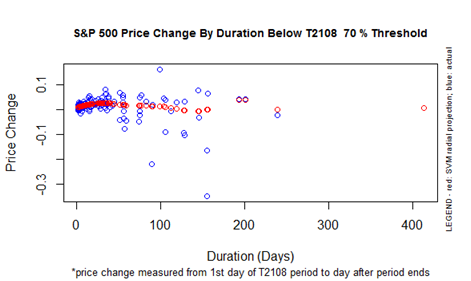
The duration of the current T2108 70% underperiod is exceptionally long compared to the historical record
The S&P 500 was last overbought on July 3rd and has gained 3.0% since then. This performance is slightly above where we would expect it to be if the S&P 500 were to become overbought again. My best guess is that the S&P 500 will be lower by the time it gets back to overbought territory: this supports my on-going assumption that the S&P 500 will chop around for a good amount of time going forward.
The volatility index, the VIX, jumped up slightly. As I stated earlier, I think the onset of earnings season will help keep volatility elevated so I am not being aggressive in fading volatility here. I have a few puts on ProShares Ultra VIX Short-Term Futures (UVXY) in case the slide in volatility continues. Otherwise, I am saving powder for my favorite volatility fade, ProShares Short VIX Short-Term Futures (SVXY), for the next extreme move. I sold my last tranche of SVXY on the previous day (not eager to hold for too long given my short-term volatility expectations).
While I made a good trade on SVXY on Thursday, I whiffed on a significant one in Conns Inc. (CONN). I wrote about this trade on December 24, 2014. It paid off in a big way on Thursday when the stock soared as much as 19.6% in the wake of December sales news. The move was fast: the entire 19.6% gain came in 10 minutes. The fade was slow enough to keep me expecting a rebound at anytime. Before I knew it, the ENTIRE move was gone. Poof. The stock is now struggling to keep from going negative post-sales release.
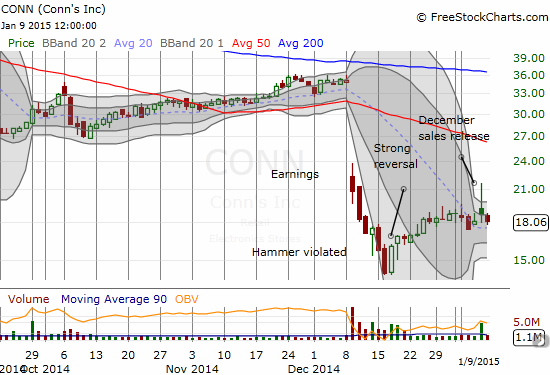
One of the more vicious one-day fades you will ever see in a stock!
The options part of the trade expires this Friday. If I had been smarter/faster, I would have sold the long call position immediately, but I was trying to ride the gains. Now, it seems more likely I will end the week more or less flat and facing a decision as to whether to try this trade one more time. I hope the action in the options pits provide clues once again.
Daily T2108 vs the S&P 500

Black line: T2108 (measured on the right); Green line: S&P 500 (for comparative purposes)
Red line: T2108 Overbought (70%); Blue line: T2108 Oversold (20%)
Weekly T2108

*All charts created using freestockcharts.com unless otherwise stated
Full disclosure: long GLD, net short Australian dollar and Japanese yen, net ...
more

