
Recent Changes In S&P 500 Betas
This article explores some data related to betas of stocks in the S&P 500. The betas are derived from Yahoo's data closing prices over at least the last 60 market days. Instead of data over the last 5 years assuming monthly returns (as others seem to be using), the analysis below is looking at short-term data and changes over one month. Betas for individual stocks can vary broadly over the long term (such as 5 years) and thus will not recognize either convergence or divergence from correlation with the market. Thus any investor relying on outdated data may be greatly disappointed by changes in the betas in their portfolio by either experiencing higher volatility or lower than expected returns compared to the market.
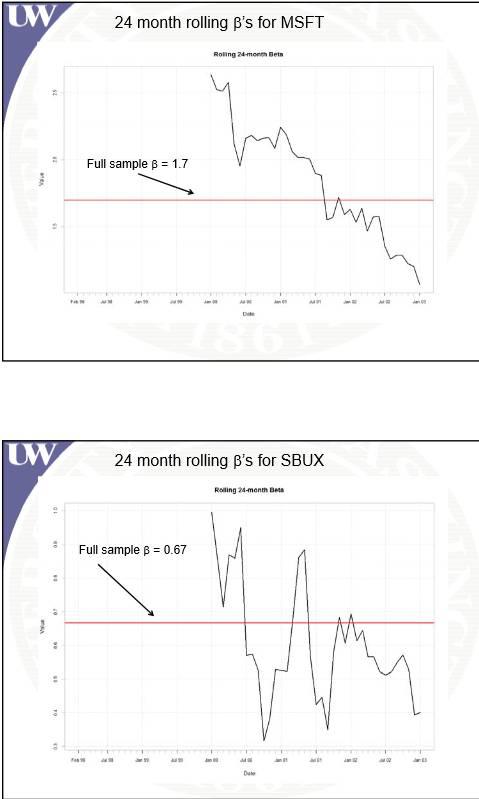
The two graphs below shows the rolling betas for MSFT and SBUX based on monthly returns over 1998 to 2003. Each monthly beta is calculated from the previous 24 months. Thus SBUX went from a beta statistically the equivalent of 1 and then drop to nearly no correlation with market movements at a beta of nearly 0.3.
|
TICKER |
NAME |
beta |
Std_Error |
|
(NYSE:S) |
Sprint Nextel Corporation |
-0.4877068477 |
0.3303151153 |
|
Commercial National Financial |
-0.4027969918 |
0.2071742794 |
|
|
(NASDAQ:LARK) |
Landmark Bancorp, Inc. |
-0.1056887708 |
0.2743567648 |
|
(NASDAQ:DELL) |
Dell Inc. |
-0.0085974985 |
0.1460150802 |
|
(HNZ) |
H.J. Heinz Company |
0.0675427983 |
0.0201133292 |
|
(NYSE:WMT) |
Wal-Mart Stores, Inc. |
0.2076575322 |
0.1379532429 |
|
(NYSE:HUM) |
Humana Inc |
0.2190943119 |
0.3314447711 |
|
(NASDAQ:LIFE) |
Life Technologies Corp. |
0.3009069715 |
0.3024882011 |
|
(NYSE:DTE) |
DTE Energy Company |
0.3575477301 |
0.1162566893 |
|
(NYSE:VZ) |
Verizon Communications Inc. |
0.3602964547 |
0.1649149178 |
|
(NGPC) |
NGP Capital Resources Com |
0.3762632023 |
0.2330343513 |
|
(NYSE:TGT) |
Target Corporation |
0.3912563636 |
0.1687907318 |
|
(NYSE:MCD) |
McDonald's Corporation |
0.3946398107 |
0.1254790994 |
|
(NYSE:SWY) |
Safeway Inc. |
0.4208148931 |
0.5122297288 |
|
(NYSE:KSS) |
Kohl's Corporation |
0.4309336384 |
0.2454407501 |
|
(NASDAQ:PRGO) |
Perrigo Company |
0.4335721026 |
0.1407391171 |
|
(NYSE:ED) |
Consolidated Edison, Inc. |
0.4339126006 |
0.1027138289 |
|
(NYSE:JCP) |
J.C. Penney Company, Inc. |
0.4391550507 |
0.7556687073 |
|
(NYSE:LO) |
Lorillard Inc. |
0.4420005301 |
0.190241873 |
|
(NYSE:NLY) |
Annaly Capital Management |
0.4452958678 |
0.1709794296 |
The above table shows the lowest betas including negative ones along with the standard errors of the betas derived from the linear regressions. This shows that while there a few negative betas, none are significantly different than zero. Specifically, that means that the true beta could easily be with-in the range of zero. While that would negate the positive aspects of negative betas, it does provide stocks that are not reacting to the market forces and thus can reduce market risks. But conversely it does reduce idiosyncratic risks of the individual stocks.
The next table shows the highest beta stocks in the sample. A portfolio composed of those stocks would basically be a multiplier of 2 times the market. This is great for up markets but down markets drive the portfolio 2 times the market loss. Other investors might find value in shorting such stocks as it would take less percentage of the portfolio for the same level of hedging.
|
TICKER |
NAME |
beta |
Std_Error |
|
(NYSE:TSO) |
Tesoro Corporation |
2.4531115321 |
0.3495856337 |
|
(NYSE:PHM) |
PulteGroup, Inc. |
2.4438357859 |
0.3159469641 |
|
(NYSE:GNW) |
Genworth Financial, Inc. |
2.395835959 |
0.294622434 |
|
(NYSE:VMC) |
Vulcan Materials Company |
2.3777750591 |
0.2604397751 |
|
(NASDAQ:MU) |
Micron Technology, Inc. |
2.2820217495 |
0.3501231721 |
|
(NYSE:TXT) |
Textron Inc. |
2.187683664 |
0.3112272632 |
|
(NYSE:MAS) |
Masco Corporation |
2.1863935603 |
0.2813784391 |
|
(NYSE:LYB) |
LyondellBasell Industries NV |
2.148103208 |
0.2493911153 |
|
(NYSE:MS) |
Morgan Stanley |
2.1458662521 |
0.2325657375 |
|
(NYSE:LNC) |
Lincoln National Corporation |
2.1334180647 |
0.2057739005 |
|
(NYSE:PXD) |
Pioneer Natural Resources |
2.1164534686 |
0.2540573279 |
|
(NYSE:EMN) |
Eastman Chemical Company |
2.11247894 |
0.2653843697 |
|
(NYSE:IP) |
International Paper Company |
2.1004101017 |
0.2437184687 |
|
(NYSE:FLR) |
Fluor Corporation (NEW) |
2.0836355613 |
0.2346553502 |
|
(NYSEARCA:TAN) |
GUGGENHEIM SOLAR ETF |
2.0782098748 |
0.4796943311 |
|
(NYSE:LEN) |
Lennar Corporation |
2.0692987457 |
0.2919392501 |
|
(NYSE:HIG) |
Hartford Financial Services |
2.043250359 |
0.1927730644 |
|
(JDSU) |
JDS Uniphase Corp |
2.0274793661 |
0.343474719 |
|
(NYSE:PSX) |
Phillips 66 |
2.0012931438 |
0.2662966576 |
|
(NYSE:STM) |
STMicroelectronics |
1.9931547449 |
0.3343185738 |
The next two tables show the biggest percentage gains and declines in betas respectively. The two time periods have at least 60 market days before May 18th and April 18 for each stock. The tables also include the latest values for beta and the standard errors for the betas. As stated earlier, betas can and do change over time, thus it behooves investors to keep a watch on the betas of stocks in their portfolios.
|
TICKER |
NAME |
% Change in Beta |
beta |
Std_Error |
||||
|
(NYSE:KIM) |
Kimco Realty Corp |
1195.3112779008 |
1.0689650451 |
0.1066394098 |
||||
|
(NYSE:DV) |
DeVry Inc. |
157.1222269273 |
1.0666570073 |
0.5208901599 |
||||
|
(NASDAQ:NFLX) |
Netflix, Inc. |
118.091417104 |
1.2759550409 |
0.665431834 |
||||
|
(NYSE:EW) |
Edwards Lifesciences Corp |
102.4104171987 |
0.7656351022 |
0.5464065352 |
||||
|
(NASDAQ:APOL) |
Apollo Group Inc |
79.1965727448 |
1.4372014995 |
0.4106304973 |
||||
|
NGP Capital Resources Com |
75.9426015725 |
0.3762632023 |
0.2330343513 |
|||||
|
(NASDAQ:MNST) |
Monster Beverage Corp |
66.6661887344 |
1.1131939273 |
0.3155209371 |
||||
|
Safeway Inc. |
60.4821470766 |
0.4208148931 |
0.5122297288 |
|||||
|
(NYSE:CLF) |
Cliffs Natural Resources Inc |
57.6041126988 |
1.204770117 |
0.7201907761 |
||||
|
(NYSE:KRO) |
Kronos Worldwide, Inc |
56.5334167202 |
1.2826832025 |
0.3286247152 |
||||
|
(NASDAQ:WCRX) |
Warner Chilcott Public |
55.1150099997 |
0.9394632534 |
0.5005997314 |
||||
|
(NYSE:LXK) |
Lexmark International Inc |
53.0776928324 |
1.2615489377 |
0.3094243047 |
||||
|
Verizon Communications Inc. |
49.8021478093 |
0.3602964547 |
0.1649149178 |
|||||
|
(NYSE:COF) |
Capital One Financial Corp. |
44.4036260789 |
1.2086898238 |
0.1937224263 |
||||
|
(NYSE:FDO) |
Family Dollar Stores, Inc. |
43.7559878934 |
0.7899445578 |
0.2007521144 |
||||
|
(NYSE:AGN) |
Allergan, Inc. |
40.5315165884 |
1.3048846016 |
0.3066415632 |
||||
|
(NYSE:RL) |
Ralph Lauren Corp |
40.0009329036 |
1.0718958716 |
0.1481217133 |
||||
|
(NASDAQ:STX) |
Seagate Technology PLC |
37.8758771482 |
1.80531024 |
0.2935230858 |
||||
|
(NYSE:COH) |
Coach, Inc. |
37.2413192605 |
0.9915540163 |
0.2724380836 |
||||
|
JDS Uniphase Corp |
32.4781414905 |
2.0274793661 |
0.343474719 |
|||||
|
TICKER |
NAME |
% Change in Beta |
beta |
Std_Error |
||||
|
Landmark Bancorp, Inc. |
-211.543355163 |
-0.1056887708 |
0.2743567648 |
|||||
|
Dell Inc. |
-101.9470151665 |
-0.0085974985 |
0.1460150802 |
|||||
|
Life Technologies Corp. |
-48.2176139137 |
0.3009069715 |
0.3024882011 |
|||||
|
H.J. Heinz Company |
-42.1854188272 |
0.0675427983 |
0.0201133292 |
|||||
|
(NYSE:TDC) |
Teradata Corporation |
-35.8985596421 |
0.6502681867 |
0.378376679 |
||||
|
(OTCQB:ACCA) |
Acacia Diversified Holdings |
-34.9022970735 |
1.3480430366 |
6.6199970148 |
||||
|
Annaly Capital Management |
-29.8343732025 |
0.4452958678 |
0.1709794296 |
|||||
|
(NYSE:UNH) |
UnitedHealth Group Inc. |
-29.5434078484 |
0.618014966 |
0.2185039516 |
||||
|
(NYSE:HPQ) |
Hewlett-Packard Company |
-28.5656508285 |
0.765489966 |
0.4104177719 |
||||
|
(NASDAQ:ISRG) |
Intuitive Surgical, Inc. |
-27.3603283196 |
0.5699540355 |
0.439580025 |
||||
|
(NYSE:APA) |
Apache Corporation |
-25.4452421638 |
0.8631432737 |
0.2140821518 |
||||
|
(ANR) |
Alpha Natural Resources, Inc. |
-25.1007883093 |
1.1333832744 |
0.5978950233 |
||||
|
(NASDAQ:BBBY) |
Bed Bath & Beyond Inc. |
-24.9419904711 |
0.6219201809 |
0.2068991431 |
||||
|
(NYSE:PFE) |
Pfizer Inc. |
-24.2010333867 |
0.7231582417 |
0.1702084756 |
||||
|
(NYSE:ORCL) |
Oracle Corporation |
-23.5137179671 |
1.1757493886 |
0.2495331911 |
||||
|
(NYSE:TMO) |
Thermo Fisher Scientific Inc. |
-23.3462632011 |
1.1219394433 |
0.1788213094 |
||||
|
(NYSE:WMB) |
Williams Companies, Inc. |
-21.6888141159 |
0.9066895717 |
0.2085829622 |
||||
|
(NYSE:WU) |
The Western Union Company |
-21.3228860011 |
0.7108482755 |
0.202025167 |
||||
|
(NASDAQ:ESRX) |
Express Scripts Holding Co |
-19.9512241854 |
0.6516598665 |
0.1774767244 |
||||
|
(NYSE:BTU) |
Peabody Energy Corporation |
-19.8607200984 |
1.0077055929 |
0.4128686253 |
||||
|
(NYSE:GE) |
General Electric Company |
-18.9837698053 |
0.9116795611 |
0.1502187397 |
||||
|
(NASDAQ:SPLS) |
Staples, Inc. |
-18.9275214494 |
1.0549979702 |
0.3392798282 |
||||
Lists like the ones above could be used to discover stocks that balance market risks or even create portfolios like the single index model or risk budgeting for efficient portfolios. If any of the information and data was useful or interesting, I would love to hear from you. I hope that everyone that finds the information interesting to express what they like or what areas could be expanded and improved upon.


