
Intermediate-Term Market Trend
In our previous article, we showed the results of determining the long-term market trend based on the optimized statistical processing of the historical market behavior. Such analysis is based on the 15-year market historical behavior. In this article, we will show the results of determining the intermediate-term market trend with the corresponding buy and sell signals. For the intermediate market analysis, we use the daily chart and we analyze the historical price behavior for the previous two years that precedes the current month.
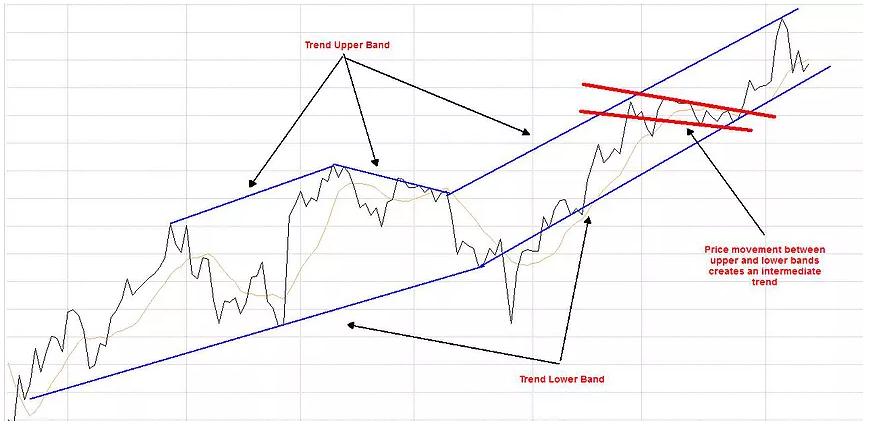
Intermediate-term investing/trading captures potential gains while the price oscillates between the upper and lower bands of the trend. The market is a self-verification mechanism. As we all know, the price never goes indefinitely up or down. Instead, it advances for some time until it hits a resistance (when the price becomes more expensive). At that point, the price typically goes down checking the support level. Only after finding the support level the price can start advancing again. The price oscillation between these two points creates a trend bands, while the price movement between these two bands creates the intermediate trend (as shown on the chart below).
(Click on image to enlarge)
SPY ETF
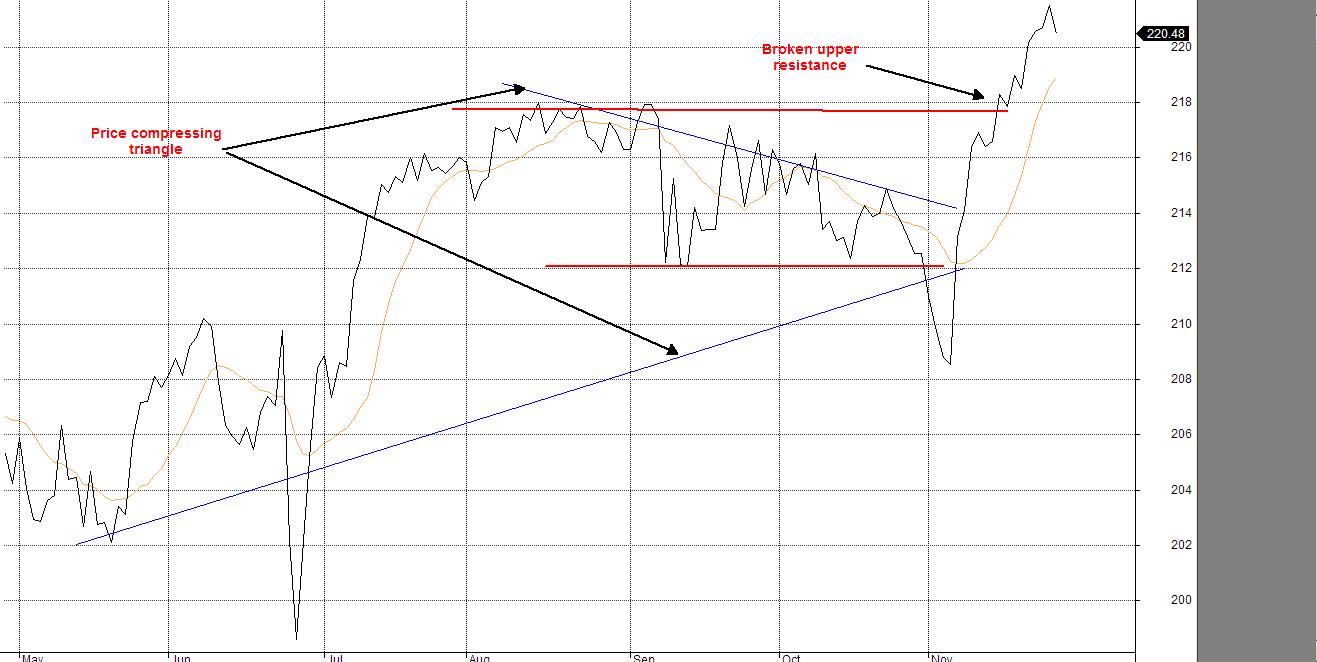
Let’s first take a look at the SPY ETF chart. By using the technical analyses, we see that SPY recently developed a triangle pattern (blue trend lines) that gradually compresses the price movement. Typically, the price has not much space to move inside that compressed space and inevitable resolves the situation by breaking the existing trend up or down, manifesting the beginning of a new trend. As we can see, in this case, the chart broke up and get even through the upper resistance (the Red upper band).
(Click on image to enlarge)
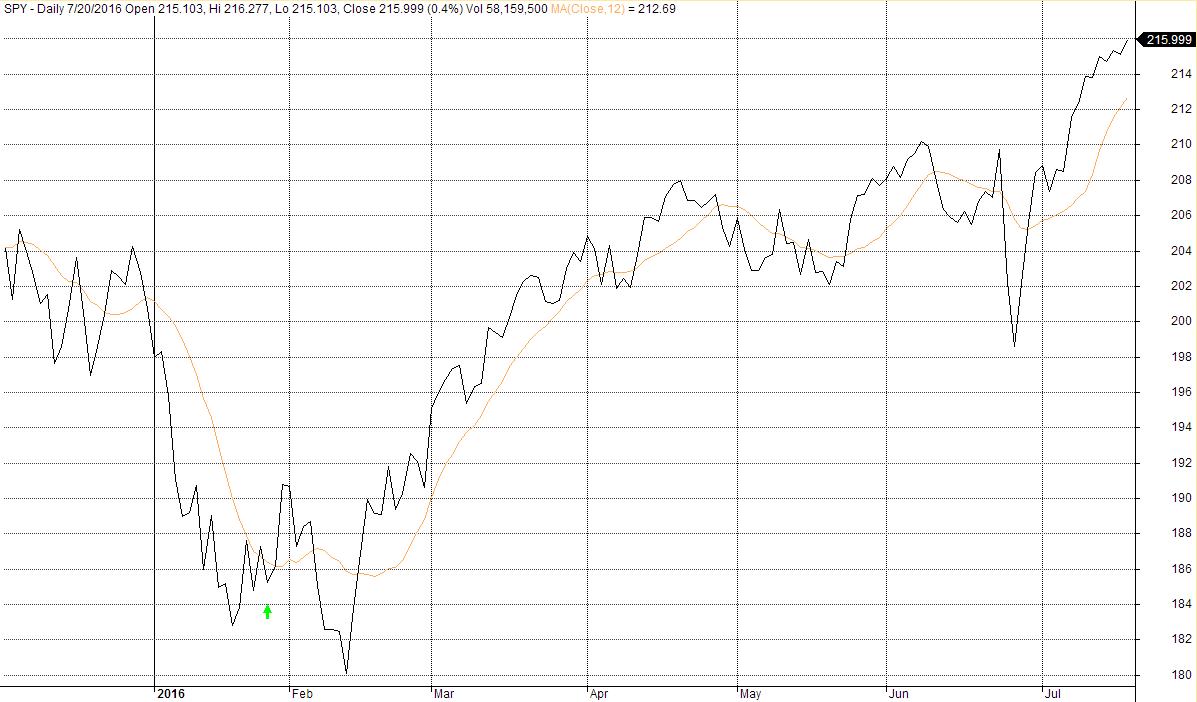
Here we show the SPY daily chart with intermediate signals. The chart below shows that the last signal was the Buy signal that has been issued on 1/27/2016 and it is still in effect.
(Click on image to enlarge)
Here is the two-year transaction log. The cumulated profit for the two-year investment following this method is 39,672.93
(Click on image to enlarge)
![]()
QQQ ETF
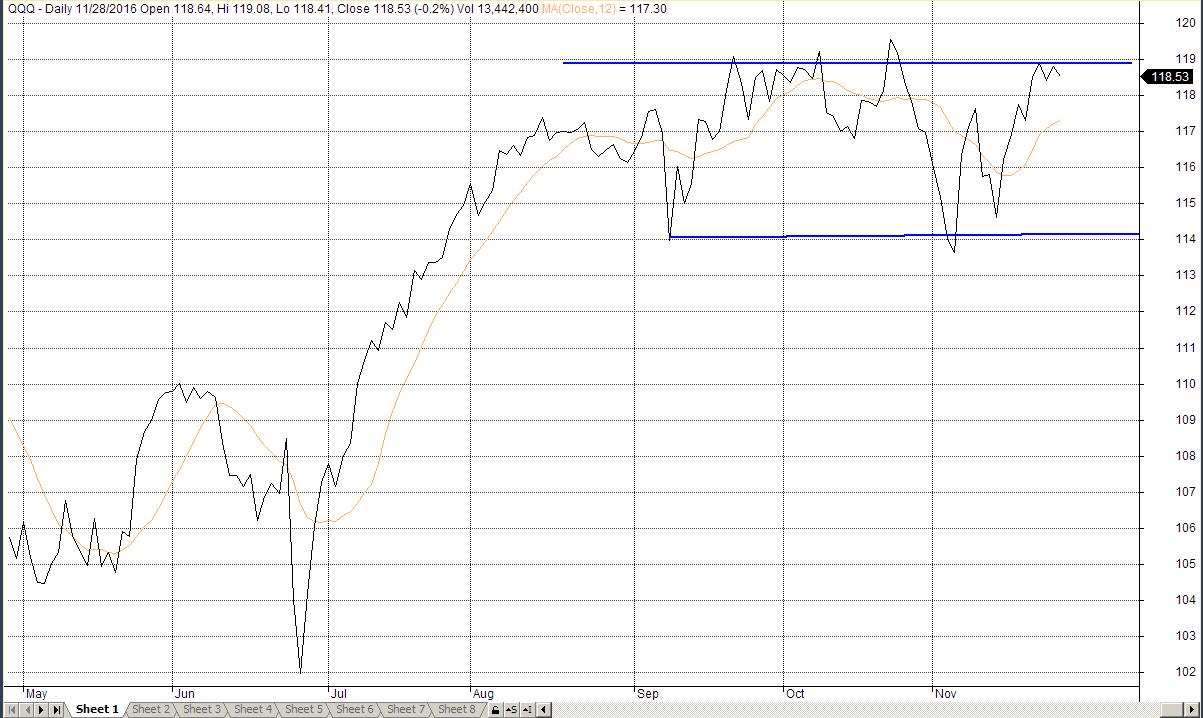
Next, let’s first take a look at the QQQ ETF chart. QQQ has a very different pattern. After some advance, QQQ price went into a consolidation state oscillating between the upper and lower trend bands (blue lines).
Here is the QQQ daily chart with intermediate signals. The chart shows that the last signal was the Buy signal that has been issued on 11/10/2016 and it is still in effect.
(Click on image to enlarge)
Here is the two-year transaction log. The cumulated profit for the two-year investment following this method is 63,316.63
(Click on image to enlarge)
![]()


