Statistically Determining Market Trend, Entry And Exit Points
Long-term investment in the stock market works pretty well under two conditions:
- The first is a duration related – to have at least 20 -30 year time interval in front of you
- The second is wealth related – you should not need the money you invested for a long-time (in other words, you should be able to lose it in a worst case scenario and still be able to maintain your current level of living).
This does work, because over a long time the market most always gradually goes up (just look at any market index chart back for 20 – 30 years). However, any market uptrend is inevitably interrupted by corrections that wipe out significant parts of the gain made previously.
Here we will show how to improve this investment process by being out of the market for the majority of time for any correction, and being in the market for the rest of the time. Our method is based on the historical market behavior and statistics. Every chart of stock/ETF has a unique behavior, which we call “Chart Signature”. Essentially, it is a chart profile that shows how volatile the chart is and how it behaves in different extreme situations. It includes such characteristics as how far the chart typically goes up before it hits resistance and how much it goes down before it find support. This method is better applied to indexes and ETFs, since their charts are more statistically stable than the stocks of individual companies.
For each such chart you build a model that describes the logic of issuing buy or sell signals when the price reaches those critical limits. You determine those critical limits by tuning the chart profile’s parameters like price, duration of advances and declines, the distances of the price from its MA - Market Average for the preceding number of years (say, 15 or 20). Tuning (or optimization) requires developing or using some software that enumerates all possible values for all parameters of the chart profile, finding the value of each one that leads to the best investment result. Every new year the chart is re-optimized to incorporate the last year experience. Once the chart profile is built, any future price movemnt is automatically analyzed with the buy/sell signals being issued when necessary.
Our method is applied to the weekly charts. We use about 13 -14 years of the chart history for building the chart profile. Of course , not all signals always lead to gains, some produce losses. But because the vast majority of signals are correct, the overall investment results are very good. Here are shown two examples of using this method of investment that follow our proprietary model.
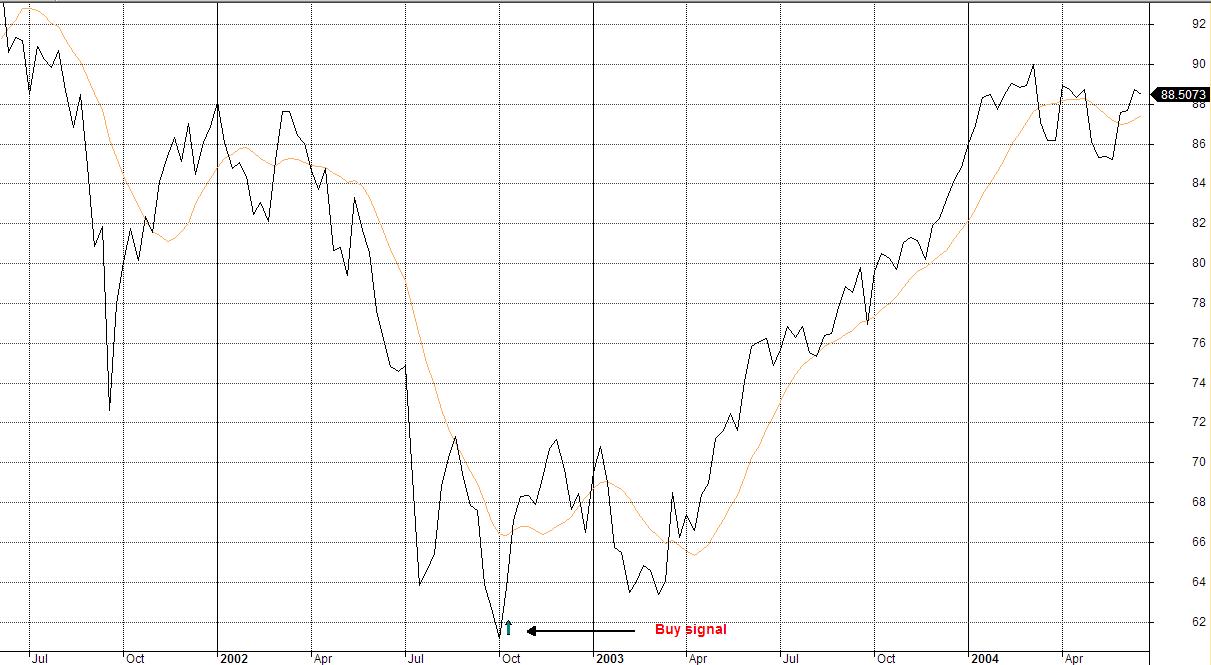
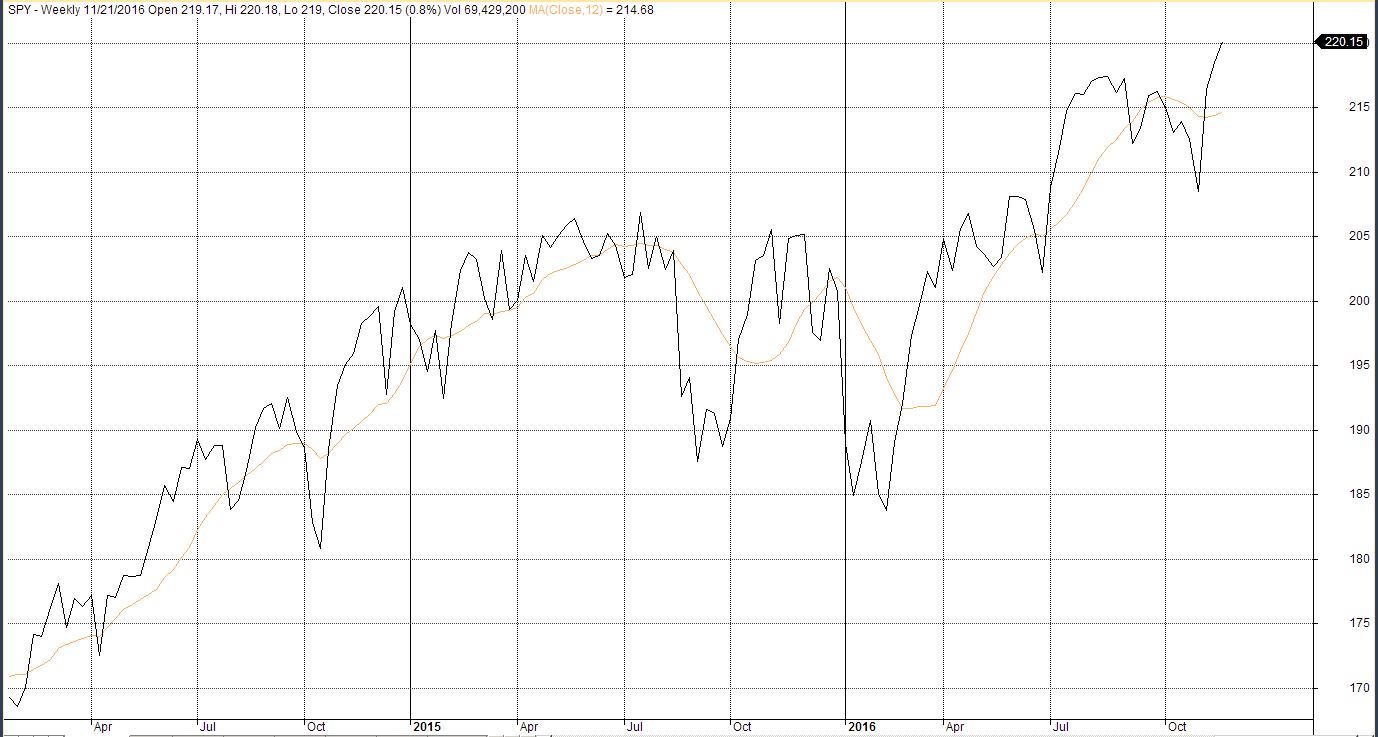
SPY ETF
Here is the list of transaction for SPY during the 15 year interval. The cumulated profit (highlighted) is $585,963.87.

The first Buy transaction has been issued on 10/11/2001.
The corresponding sell signal has been issued 1/11/2008
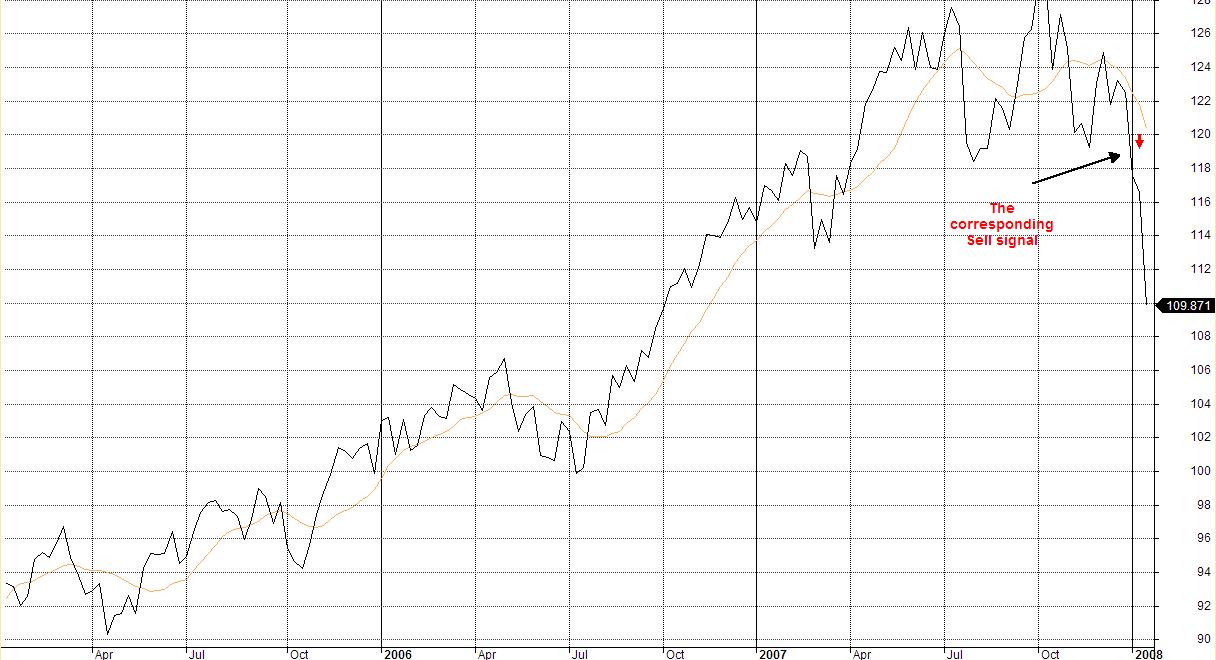 The last buy signal has been issued on 3/6/2009 and is still in effect.
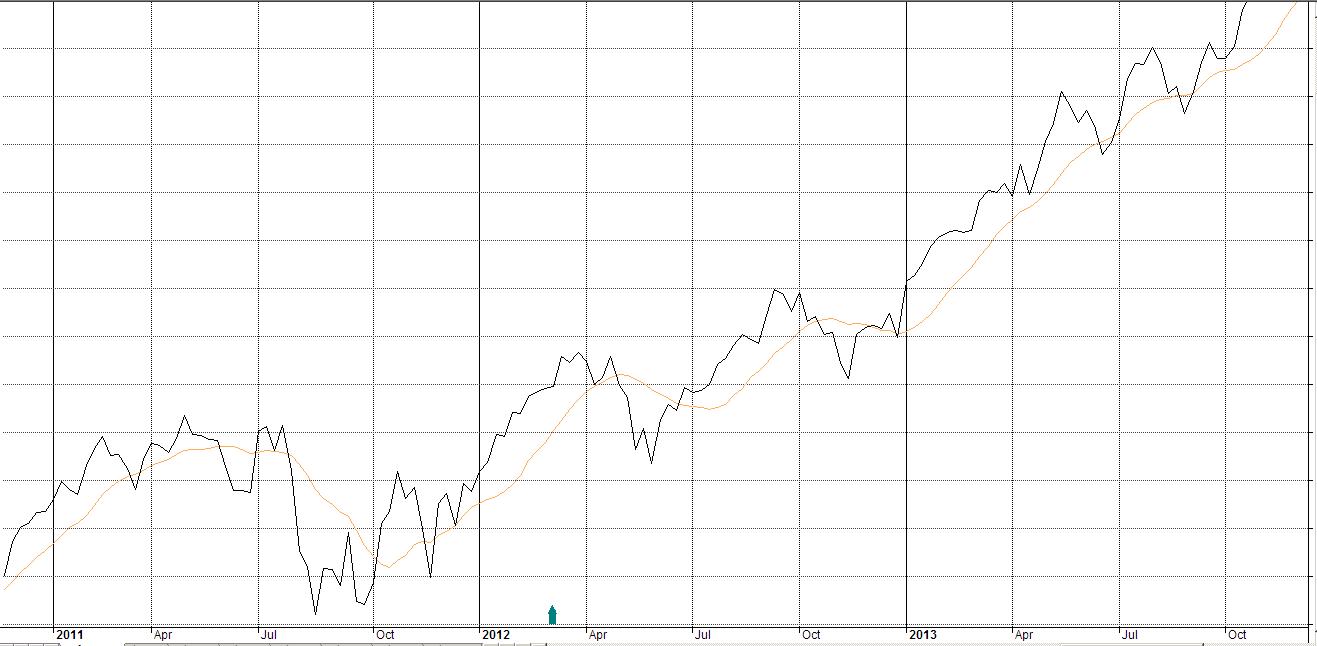
Here is the current chart
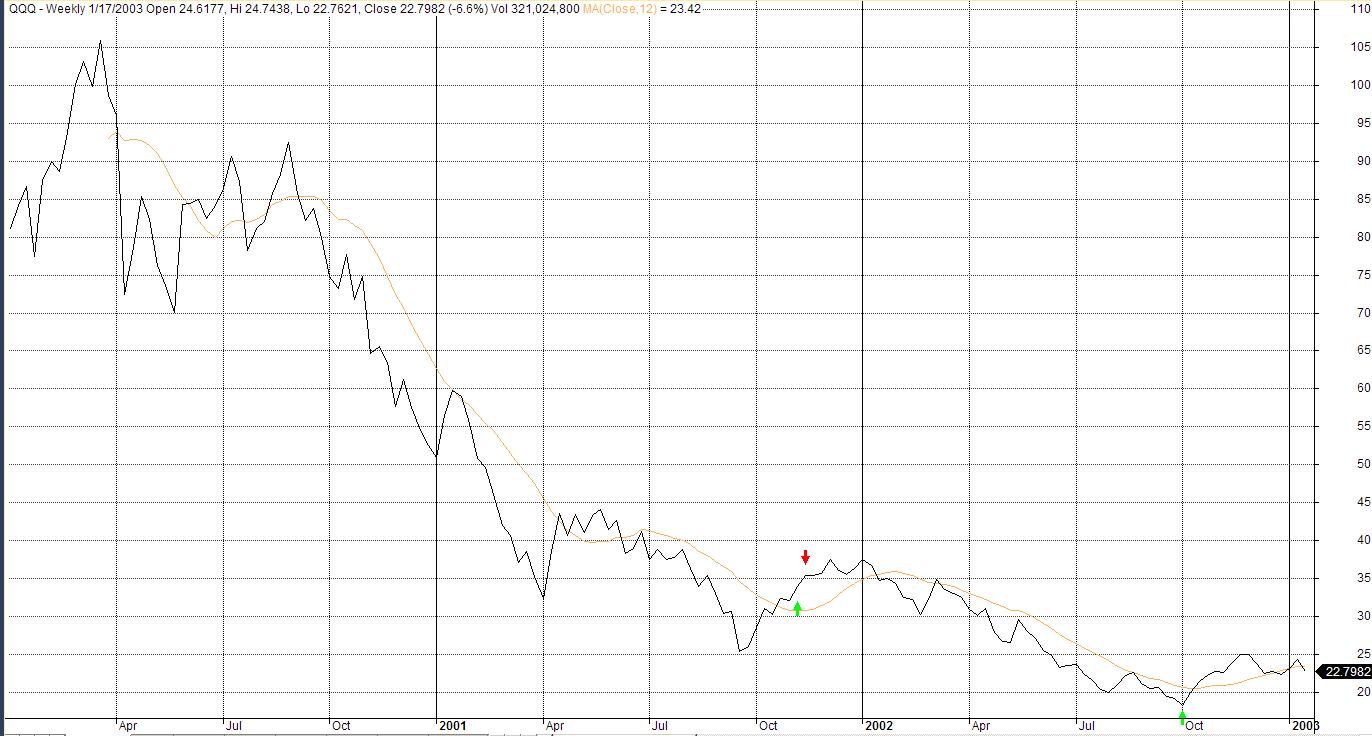
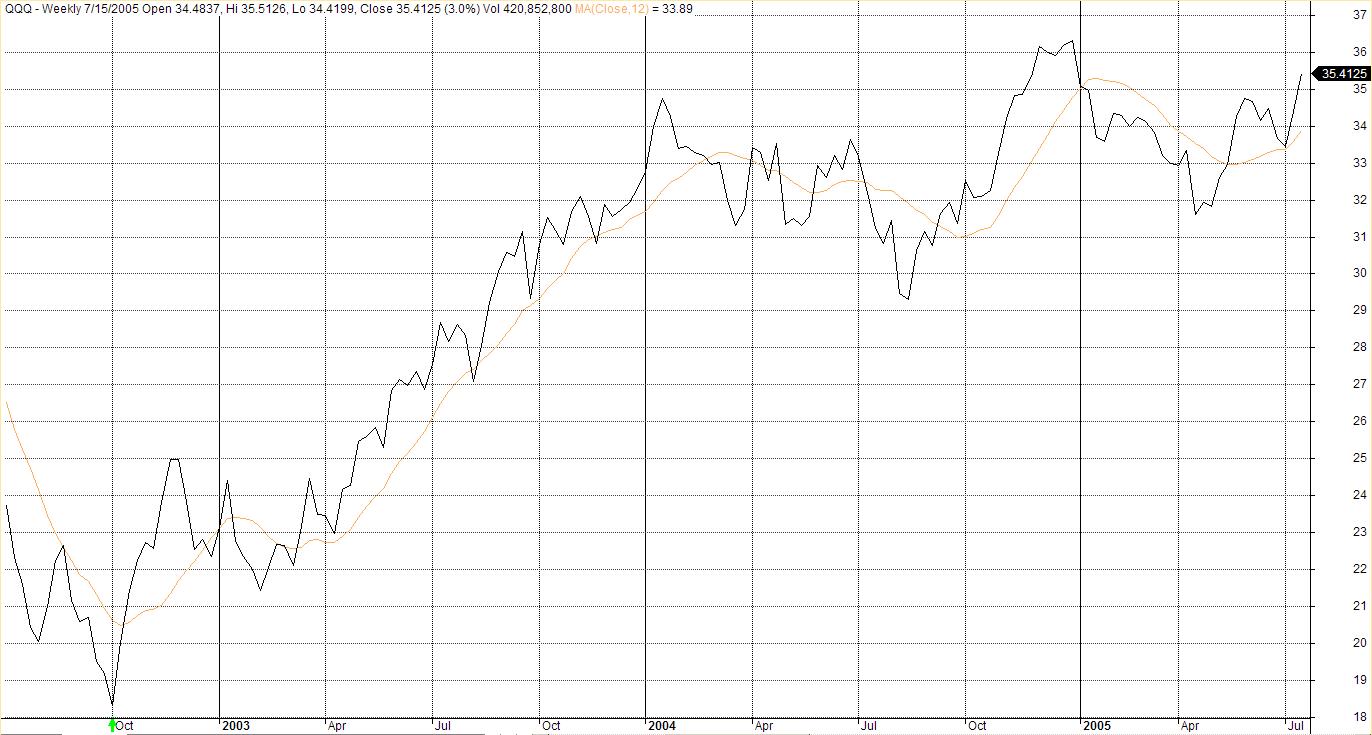
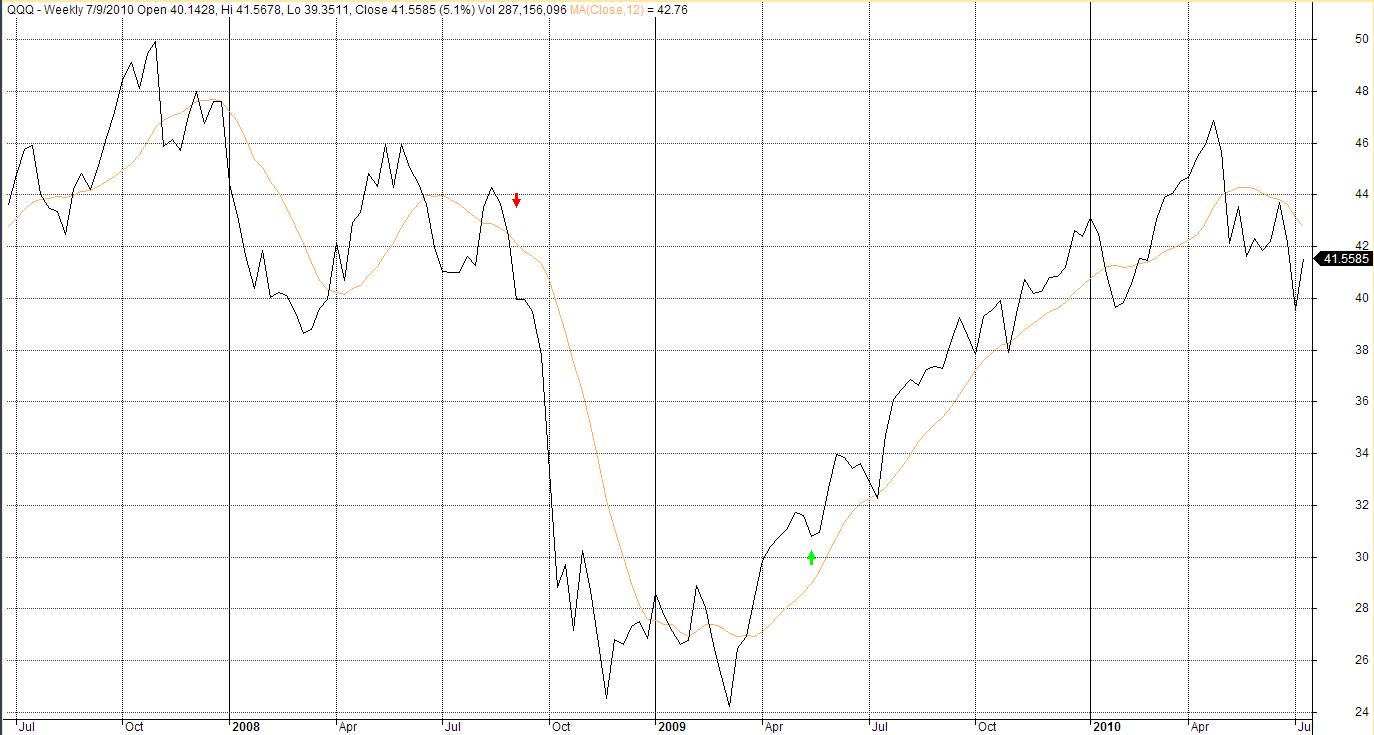
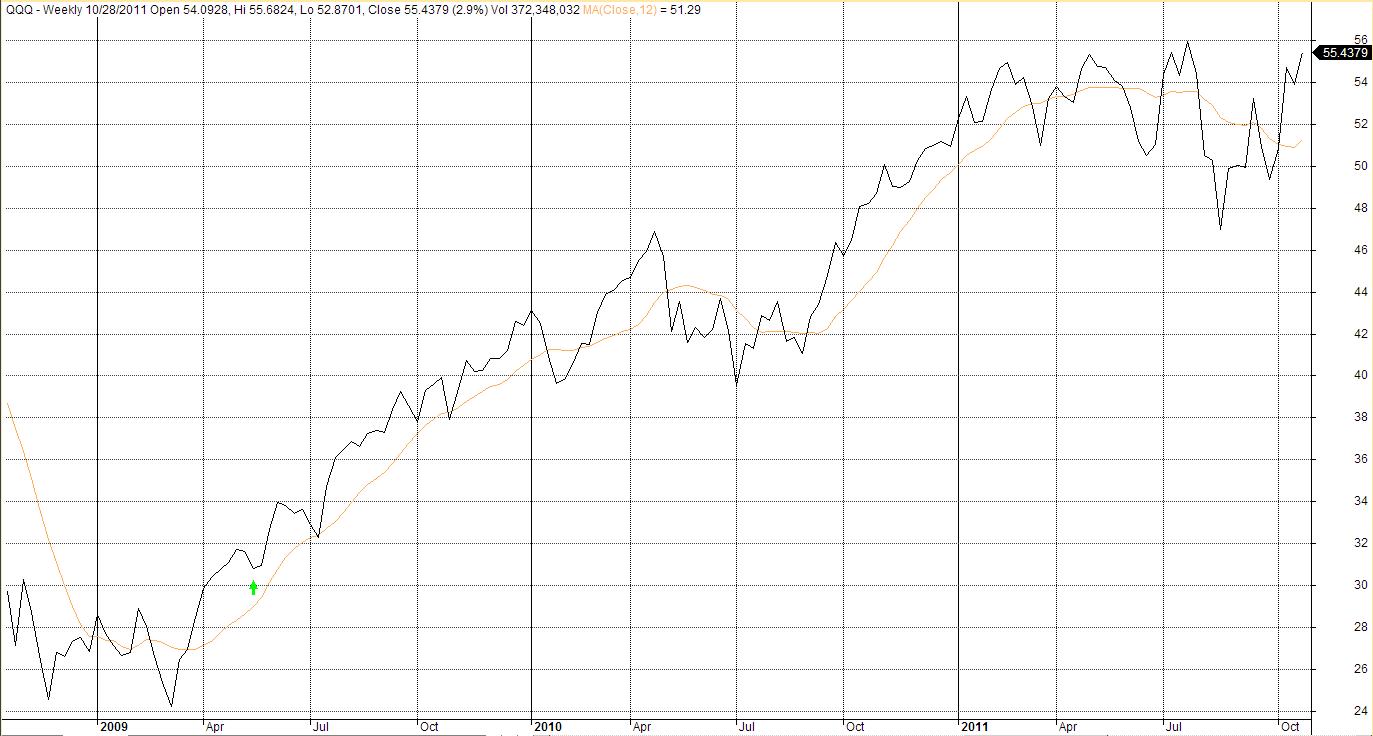
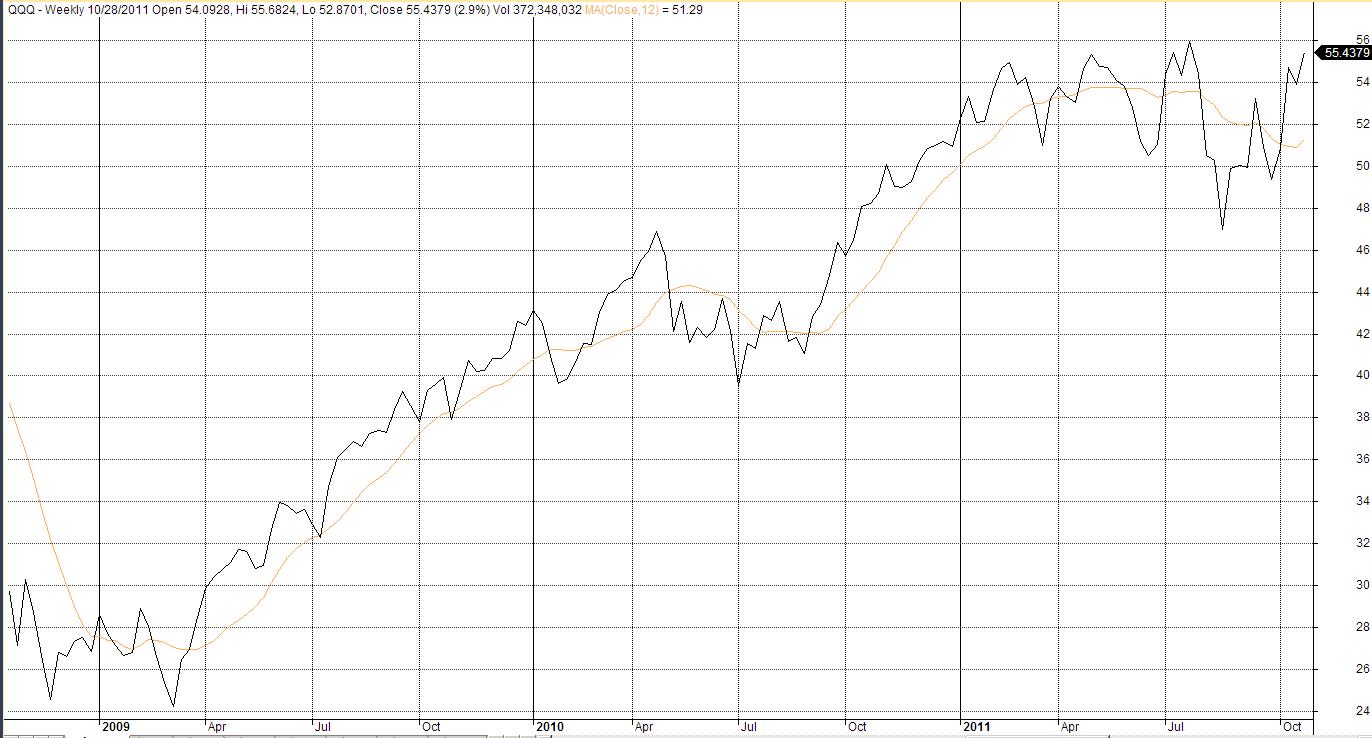
QQQ ETF
Here is the list of transaction for QQQ during the 15 year interval. The cumulated profit (highlighted) is $775,315.49.

QQQ Charts with signals