
Above The 40 – The S&P 500 Flips 180 And Wavers
AT40 = 63.5% of stocks are trading above their respective 40-day moving averages (DMAs) – ended 12 straight days overbought
AT200 = 58.8% of stocks are trading above their respective 200DMAs
VIX = 11.1
Short-term Trading Call: cautiously bullish (downgrade from bullish)
Commentary
Just when I thought it was safe to stay bullish, the stock market took a notable turn southward.
The S&P 500 (SPY) lost just a fraction of a percent, but it was enough to reverse nearly the entire gain from Friday and produce a bearish engulfing pattern. In other words, the index flipped 180 form Friday’s bullish gap up and now wavers in the middle of a classic topping pattern.
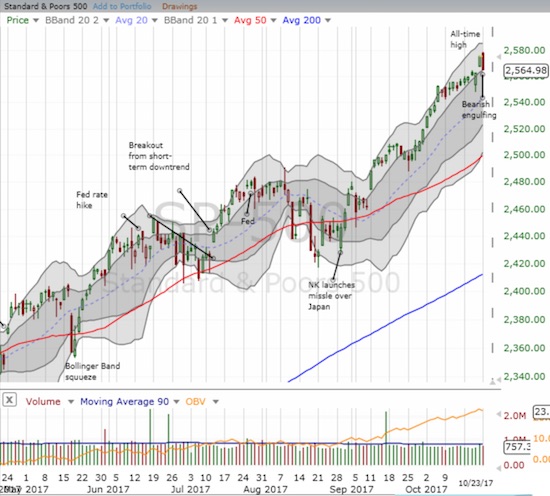
The S&P 500 printed a potential topping pattern right after gapping up to an impressive all-time high.
The Nasdaq and the PowerShares QQQ ETF (QQQ) both lost 0.6% as they each pulled away from an all-time high or a near all-time high.
Importantly, the volatility index, the VIX, put on a rare display of strength. The VIX gained 11.1% AND held its high of the day; the volatility traders actually failed to show up. This behavior suggests higher VIX levels are coming soon (like this week).
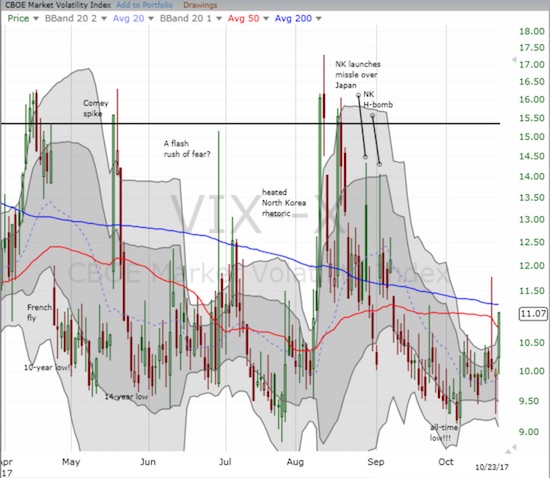
The volatility, the VIX, closed at a 6-week high.
The icing on the cake is AT40 (T2108), the percentage of stocks trading above their respective 40DMAs. My favorite technical indicator closed at 63.5%, a 1 month low. This move essentially confirms last week’s fall from overbought status…a confirmation of a bearish event.
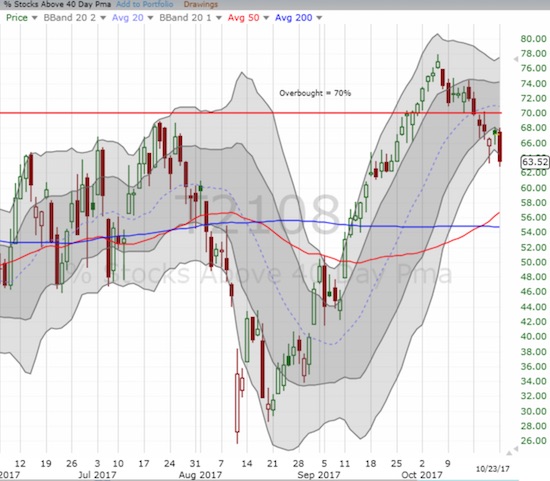
AT40 (T2108) confirmed resistance at the overbought threshold – a bearish turn of events.
All this action forced me to downgrade my short-term trading call. I hate to churn my trading call so quickly – witness my reluctance to downgrade my call when the overbought period ended. So I only went to cautiously bullish instead of neutral or cautiously bearish; I am wary that I would have to turn right around and upgrade once the stock market’s seasonally strong period begins sometime in November.
The line in the sand on the S&P 500 is the intraday low from last week’s quick sell-down (on the 30th anniversary of the crash of 1987): 2,562. If the S&P 500 closes below that level AND follows through, I will skip right through neutral and go straight to cautiously bearish.
Note that the Australian dollar (FXA) versus the Japanese yen (FXY) is still not providing confirming information. AUD/JPY remains in a bullish position by trading above its uptrending 50DMA.
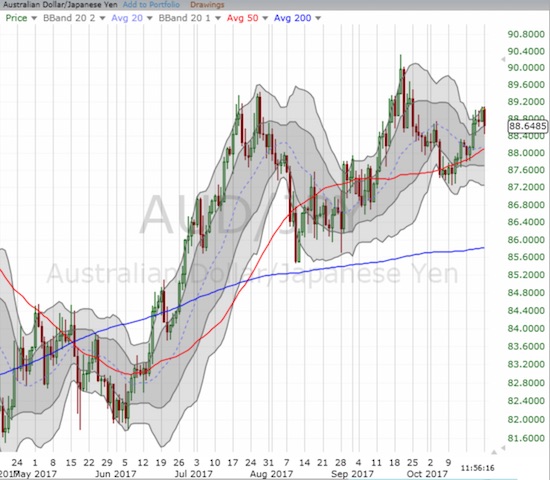
The Australian dollar is staying strong, especially against the Japanese yen. AUD/JPY continues to levitate.
STOCK CHART REVIEWS
General Electric (GE)
Over the weekend, I almost wrote a piece about GE as an example of an easy bottom-fishing play. I am glad the clock ran out on me.
Analysts were busy cranking the numbers while I was dreaming about blog posts, and their conclusions were ugly. So many downgrades and negative commentary rained down on GE that buyers went into full-scale retreat. Friday’s impressive rebound gave way to a 6.3% loss. GE barely bounced off Friday’s open and trading volume was just as heavy as Friday’s. As a bottom-fishing play, GE was a hold until/unless the stock closed below Friday’s low intraday. Optimists can see this change in events as an opportunity for a very low risk bottom-fishing play. Pessimists might salivate in anticipation of a major shorting opportunity. Regardless, GE now teeters on the edge of a resumption of the downtrend that has plagued the stock all year. Maybe 2018 will be the year for GE as a “dog of the Dow“?
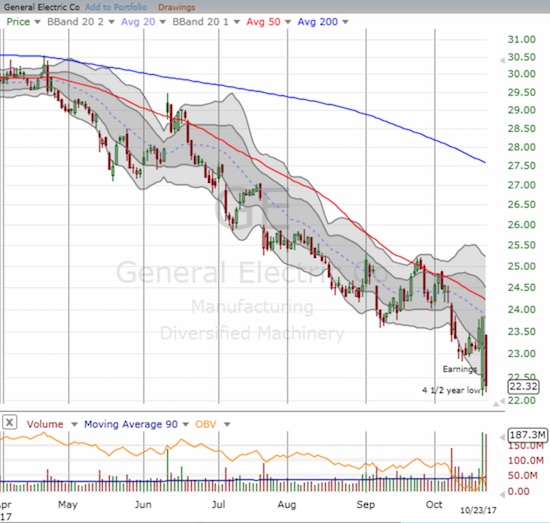
General Electric is clinging for dear life at its 4 1/2 year lows. A potential bottoming pattern may have turned into a major buying trap.
Target (TGT)
A true recovery continues with Target. Monday's 1.3% gain not only delivered impressive relative strength but also it printed a further confirmation of the stock’s 200DMA breakout. I did not buy a fresh round of call options on TGT on the breakout, but I am still holding onto my shares. Earnings are on November 15th. If upward momentum continues, I am hope I will have enough cushion to give me confidence to hold through earnings.
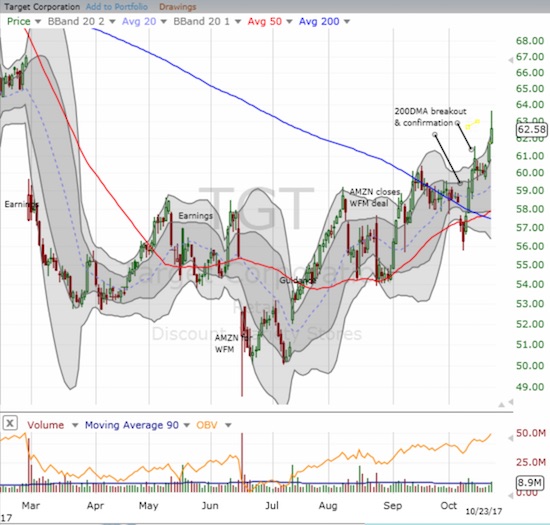
Target printed an exclamation mark on its 200DMA breakout and bottoming process.
Active AT40 (T2108) periods: Day #418 over 20%, Day #232 over 30%, Day #32 over 40%, Day #31 over 50%, Day #27 over 60%, Day #6 under 70%
Daily AT40 (T2108)

Black line: AT40 (T2108) (% measured on the right)
Red line: Overbought threshold (70%); Blue line: Oversold threshold (20%)
Weekly AT40 (T2108)

*
All charts created using freestockcharts.com unless otherwise stated
Disclosure: long TGT, short AUD/JPY
Follow Dr. Duru’s commentary on financial markets via more


