
Last week the markets moved. Bonds yields went up. Stocks went up. Inflation expectations were awakened.
What will the Fed funds rate do? How might the Fed respond?
I will do an analysis to project a path for the Fed Funds rate based on my research into effective demand. (a synopsis of the research.)
Effective Demand
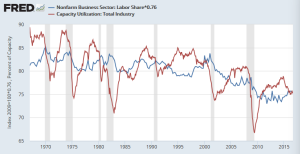
Effective demand is basically a limit upon the utilization of capacity determined by labor share. As labor share falls, the optimal utilization level of capacity also falls. We have seen labor share fall. At the same time capacity utilization trended lower. My research into effective demand is built upon the following graph.
Profit Rate Cycle
The original description that Keynes and others gave for effective demand pointed to profits as the driving factor. Once entrepreneurs see profit rates peaking, they will stop utilizing labor and capital because if they did not, profit rates would decline.
My models of effective demand track the profit rate cycle. (link)
The profit rate cycle tracks the business cycle. The following graph gives a profit rate based on profits in relation to GDP. (link to FRED data)
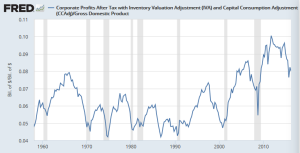
The profit rate rises and then falls in each business cycle between recessions. It would appear that this business cycle is nearing its end.
Markets after Trump victory
As I started this post, I mentioned the moves in markets during the last week. There is revived hope of getting the economy going again. Trump promises fiscal expansion, deregulation and lower taxes. In short, there seems to be a business expansion being revived using supply-side strategies.
It is not common in the profit rate cycle (graph above) for profit rates to climb back up to two major peaks before a recession. But let's assume that this business cycle can be revived without a recession taking place. What might that look like?
Path of Labor & Capital
In the model of effective demand, capacity utilization is optimized at the effective demand limit. Profits from the utilization of capital are maximized. Entrepreneurs see that profits cannot be extended, so utilization of their capital is held back.
But what about the utilization of labor? Labor is used only in order to optimize capital. The priority is to maximize capital. That is how profits are maximized. Labor actually eats into profits. So there is a dance between labor and capital, where capital is actually leading where labor goes.
The following graph tracks the path of utilizing labor and capital. Once the path hits the effective demand limit, capacity utilization will either stop rising or fall. It fell in this business cycle. I predicted this in 2013 before it happened in 2014.
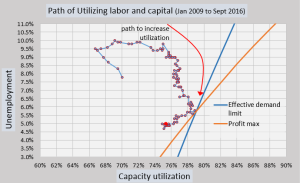
So now I look at this graph and ask... Where can this path go now assuming that the business cycle is being revived?
One thing is for sure, the unemployment rate cannot rise. That would trigger a recession and end the business cycle. So unemployment either has to stay around 5% or go lower. Then capacity utilization would have to start rising. I will assume that unemployment can go down to 4.5% while capacity utilization goes up to 78%. That would take the path back to the effective demand limit with increased utilization of labor and capital.
Projecting a Path for the Fed Rate
I have been lightly touching upon the forces that shape the business cycle so far. Mainly there is a profit rate cycle based on optimizing capital which is impacted by labor share as an effective demand limit.
The Federal Reserve would like to have monetary policy guide the business cycle into full employment while stabilizing inflation around a target.
My research has a model for describing the best Fed rate path based on the effective demand limit and the accompanying profit rate cycle. (link) Basically the Fed rate needs to be normalized at the effective demand limit. Normalized means that the Fed rate equals the inflation target plus the natural real rate of growth in the economy. Currently the inflation target is 2% and the natural real rate is estimated around 2%.
Here is my estimation of the natural real rate which is based on my estimation of potential GDP.
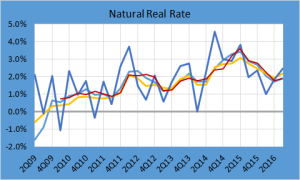
The natural real rate changes as economic conditions change. The natural real rate normally peaks around the peak of the profit rate cycle. I will assume that the revival of the business cycle taking place at the moment raises it to 2.5% which is still below the previous peak and honors the business expansion expectations currently taking place.
So now I plug into the model the numbers needed. Optimized capacity utilization = 78%. Unemployment = 4.5%. Natural real rate = 2.5%.
The model kicks out an equilibrium inflation target which the economy would find easier to maintain. In the past recent years, the model kicked out an equilibrium inflation target below 2%. But now it kicks out an equilibrium inflation target of 2.3%. This means that inflation potential is rising with the selected parameters.
Here is what the model forecasts.
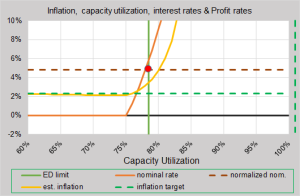
Let's start the analysis with the vertical green line which is the effective demand limit. It sits at 78% of capacity utilization. That is where capital will be optimized. Next, the normalized Fed rate would be 4.8% based on a natural real rate of 2.5% plus an equilibrium inflation potential of 2.3%. (Inflation potential is rising with the projected plans for fiscal policy. The Fed would have to push the Fed rate a bit higher to control inflation.)
Next, the solid orange line shows the path of the Fed rate to normalization (red dot) when capital is optimized. It currently sits near the zero lower bound with a capacity utilization near 75%. The path upward is measured by increases in capacity utilization.
The solid yellow line shows a projected path for inflation potential. The model shows that core inflation could reach 3.2% at normalization. Inflation potential would increase. So the Fed might have to raise the Fed rate a bit faster to control inflation.
The path is steep upward depending on how fast capacity utilization can rise. Stan Fischer of the Federal Reserve says rates need to go up gradually. So if capacity utilization goes up gradually, everything should be alright. However, there is a possibility that the Fed rate will need to go up faster than some at the Fed are prepared for depending on if the fiscal stimulus is aggressive.
If the Fed rate rises too gradually in relation to capacity utilization, one might expect a bubble to form somewhere or inflation to push upward faster than wanted.
IS-LM Perspective
Now it may seem pretty crazy for a model to project such a steep path upward. Yet, the IS-LM model gives a similar view of how this happens. At the end of a business cycle, the LM curve can be steep or vertical.
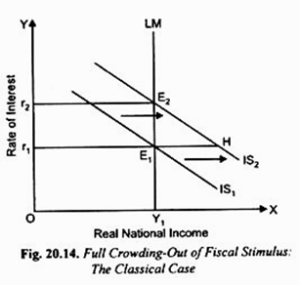 (
(The figure shows that as the IS curve shifts rightward due to strong fiscal stimulus, interest rates rise (r1 to r2), but output really does not. My model has a method to optimize the x-axis with effective demand to show where the "LM" curve goes vertical.
Concluding Thought
I see trouble ahead. There are forces ready to push inflation and interest rates up, but the effect upon real GDP will be disappointing.
Economists do not have a measure of an effective demand limit. My research is unique. So they would not expect the renewed expansion to end so abruptly. That will create confusion. I foresee frustration between the government and the Federal Reserve.
The problem rests in that the business cycle is already in its dynamics of ending. The Fed rate has gone way behind the curve letting the business cycle develop more zombie soft spots than normal. Zombie soft spots drag down net economic benefits to society. So the economy is sensitive to the discipline of higher interest rates in a negative way.
Comments
Log in or sign up to join the conversation.