
Mr. Market As Income-Stock Expert
At the end of my last article on the Interest-Rate Income-Investing Crisis, I said I’d offer a strategy that would help yield-hungry equity investors work with the broad range of choices in between the highest yielding riskiest stocks and the least risky lowest yielders to uncover some reasonable in-between opportunities. So here goes.
At the bottom of this article, you’ll find a list of 20 here-and-now stock ideas along these lines. Feel free to skip down to there if you wish. But with all the bullish ideas flying about nowadays on TV, on the web, in social media, etc., I think it’s important that you develop approaches to vetting what you read and hear. It’s not good enough to simply note that somebody somewhere recommended a stock (given that every trade has a both a seller and a buyer, you can ALWAYS find someone somewhere who likes and dislikes every stock every day). So I urge you to filter every idea that comes your way to assess whether or not it makes sense, not for the world in general, but for you specifically. That’s why I’m describing here why my list includes the specific stocks it includes, as opposed to any one of who-knows-how-many other possibilities.
In future postings, I’ll discuss individual names from the list that seem particularly interesting beyond their having the characteristics that caused them to make it onto the list.
The Starting Point for This Strategy: Ask Mr. Market
In the last article, I discussed a series of simple models and tests that demonstrated the truth behind the long-understood income seeker’s adage that very high yield spells probable danger. But we do not have to take that as a warning, throw our hands up and run for cover.
Typically, income investors start with a minimum yield threshold and then refine by looking at things like payout ratio (the percent of net income devoted to dividends, with lower levels signifying less risk) or dividend growth (higher figures are supposedly bullish since dividend growth is an important element of this kind if investing). But we can bypass that at this stage. Our recognition that Mr. Market is pretty good at evaluating the risks associated with dividend security opens up an interesting angle. It allows us to simply specify a range of permissible yields. So for this strategy, I follow along with most others and prescribe a minimum acceptable yield. But unlike the case with most others, I also specify a maximum permissible yield.
I started thinking in terms of a 4%-8% range. Since I test my strategies over a period of time, I can’t literally use 4% and 8% boundaries since those numbers mean different things at different times under different money-market conditions. So I tweaked and wound up translating theses levels into minimum and maximum percentile ranks within the custom “Dividend Payers” universe I created on Portfolio123 sand described in the previous article. But for the sake of convenience, I’ll discuss it in terms of a present-day 4%-8% range.
That range, no doubt, is aggressive. A 4% yield today is way above the 2,02% median for all dividend payers in my custom universe. So we know we’re taking dividend-security risk. That’s the bad news. The good news is that we don’t have to won’t do this passively. Once Mr. Market hands us his list of eligible candidates (about 100 of them as of today with the other 900-1,000 Dividend-Payers universe stocks discarded because of yields above or in more cases below that range), we’re going to say to him “Thanks for your help. You’ve been wonderful. But we’ll take it from here.”
Picking and Choosing From Mr. Market’s Nominations
First things first: Lets’ double-check to confirm the caliber of the selections Mr. Market is handing us. Figure 1 depicts the results of a ten-year backtest assuming we hold a portfolio consisting on all of the 4%-8% yielders (remembering that the specific numbers vary over time to make sense relative to changing money-market conditions) Mr. Market is showing us. This is not a for-real test, since most of us would not consider owning all 100 or so issues. But it does at least preliminarily suggest we’re not barking up the wrong tree as we do more analysis on the list Mr. Market has given us.
Figure 1
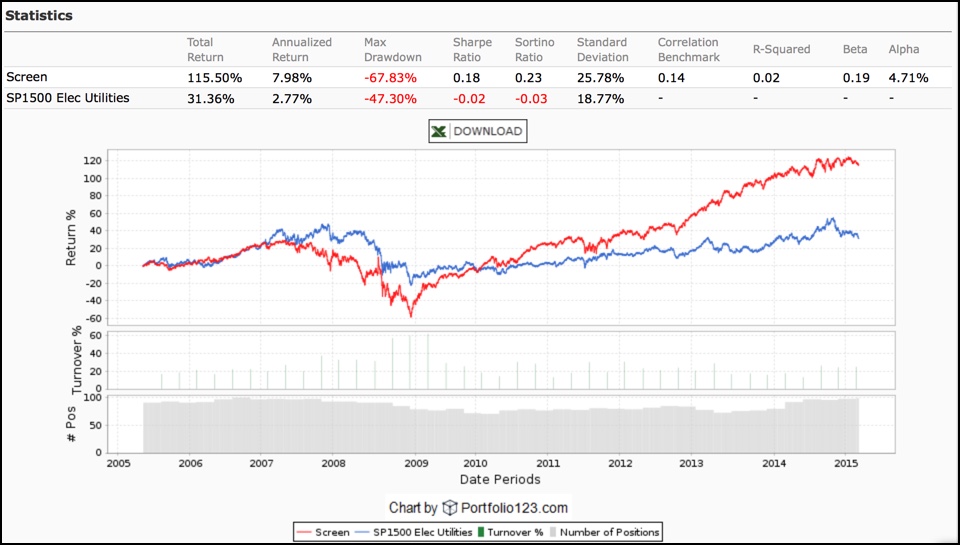
As discussed yesterday, things were rotten leading up to and during the financial crisis. There were a lot of Financials in the mix and this group was at the epicenter of the implosion. But that aside, the overall group turned in a pretty respectable performance. It outdid all three naive models I discussed in the last article. So yes, it pays to see if we can pick effectively from this group.
For purposes of reasonable diversification in an individual account, I think you could select as few as 10 issues. If, like me, you trade at a cost-efficient firm like FolioInvesting.com, you can go higher (my actual income portfolio holds 30-issues). This is a matter of individual choice. For purposes of publication here, I think 20 sounds like a nice number of positions with which to work. (Please don’t ask me for more detail on how I get to that specific number. It feels sensible for this context. There is no science to it. Correction: There are many who think there actually is a science to this, but I think that’s just a bunch of classroom nonsense; a topic for another day.)
The next thing to consider is how we’re going to pick 20 stocks.
Essentially, I’m going to pick the 20 that score highest in a Portfolio123 ranking system I created specifically for the purposes of sorting aggressive dividend-paying equities.
I’ll start by telling you what is not being considered.
First is payout ratio, the old standard regarded as the bedrock of analysis by most income investors. I’m ditching it for two reasons:
- It’s harder than many realize to evaluate a payout ratio. Net income, one of the numbers in the formula, is prone to all sorts of oddball gyrations that mean nothing in the grand scheme of things. Also, different kinds of businesses with different characteristics relating to cash flow stability make different kinds of payout ratios acceptable.
- Remember Mr. Market’s role in screening nominees for this sort. If the payout ratio is “too high” given the circumstances relevant to the particular company, we can presume Mr. Market will have already crossed it off the list due to an exorbitant yield that reflects investment-community fear. Given the challenges of evaluating the ratios that are published in databases, Mr. Market, by working this way, is likely to do a much better job than we can since we know he’s really a fictional being that represents the sum total of a lot of others who are more attuned to the less-easily quantifiable aspects of the situations.
I’m also eliminating dividend growth from my list of things to look at.
- Dividend growth is very important. But the only data we have comes from the past and in this situation, we run right smack into the past-performance-does-not-assure-the future argument. However, market practitioners understand that relatively high yields tend to be present for shares of companies likely to have less enticing-future dividend growth prospects, and vice versa. So considering the nature of the list we asked Mr. Market to give us (aggressive yields between 4% and 8% in today’s terms), let’s just assume that regardless of what the historic data shows, prospects for future dividend growth from these companies are lackluster. I have nothing against dividend growth strategies. In fact, I love them. But that is a topic for another day. This strategy is about current yield.
Now for the good stuff: Here are the factors this model does look at.
- Value (40% of the score)
I measure value using just one criterion: Price to Trailing Cash Flow per share. This is simple cash flow; net income pus depreciation. I’m not subtracting capital spending.
This may seem odd for an income model, where yield (dividend divided by price) is the primary metric against which the reasonableness of the stock price is measured. Actually, though, I’m pursuing the same thing. But instead of comparing price to dividend, I’m comparing price to the cash stream from which dividends can be paid. The larger this item relative to price, the greater the ability of the company to at least maintain its payout.
- Fundamental Quality (60% of the score)
This category is divided 50-50 between two sub-categories: Financial Strength and Return on Capital. While it’s hard to say either category would be much of a difference-maker among income stocks in general, I think they rise to that level for the specific aggressive-yielders niche carved out for us by Mr. Market. For our collection of candidates, I think we’re beyond basics like payout ratios and need to capture broader indications of fundamental condition.
As to the details:
Return on Capital: Return on Investment (ROI), the leverage-neutral indicator of business profitability is the primary metric here, with trailing 12 month and five-year average ROI accounting for 30% and 40% respectively of the Return on Capital sub-category. Return on Equity (ROE), the bottom-line profitability metric that also takes account of the company’s use of leverage, is also measured on trailing 12 month and five-year average bases (accounting for the remaining 10% and 20% respectively of this subcategory).
Financial Strength: When the market is, let’s say watchful, as is the case with stocks in the yield range that presently interest us, it helps to focus on stronger balance sheets. This particular model goes right to the heart of the balance sheet’s impact on dividend-paying capability with a 65% subcategory weighting in the trailing 12 months Interest Coverage ratio. The remaining 35% is based on the latest Total Debt to Capital ratio, lower being better. The debt sort, done as it is relative to the dividend-payer universe, will bias the model toward companies in industries that normally use less debt. If a company is in a normally debt-heavy business, such as media, it has more than ample opportunities to excel in other respects and offset a low score here.
I doubt this is or will be the final word on this sort of thing. As I continue to look into ways to reduce risk among aggressive-yielding stocks, I’m sure I’ll come up with improvements. But the test results (see below) combined with my own real-money experience using this ranking system since late 2010 warrants presenting this right now.
Test Results
We know we’re not going to get the declines in rates that characterized the historic sample periods available to us. So definitely take all of this with a grain of salt. Here is what you can reasonably look for:
Consider standard deviation (an indicator of portfolio volatility, or choppiness). High readings here are what you’d expect if to many the stocks have been getting hammered by dividend cuts or investment-community fears that the dividend is about to get whacked.
Consider returns relative to what’s available elsewhere to income seekers. The absolute levels may be hard to come by in the future if rates rise. But at least let’s look for returns that whatever they’ve been in the past are, at least, better than those of the benchmark, the S&P 1500 Electric Utility Index. In doing so, we have to bear in mind that this index is a price index, while portfolio data is presented on a total-return basis. So we’ll need to mentally add about 4%-5% to the annualized rate of benchmark performance we encounter.
Meanwhile, I really wish we had a good data sample consisting of periods of rising interest rates. We don’t. But we can, at least, try to make do as best we can with what we’ve got. I’ll show you a ten-year test, as a formality, to match up with what I showed in the last article (Figure 2). I’ll also show three much shorter periods. All tests assume rebalancing every three months and 0.25% per share in price slippage. Also, bear in mind that our testing does not include the impact of reinvested dividends. In a rising interest-rate environment, this could be a meaningful thing.
Figure 2: The 10-Year Test
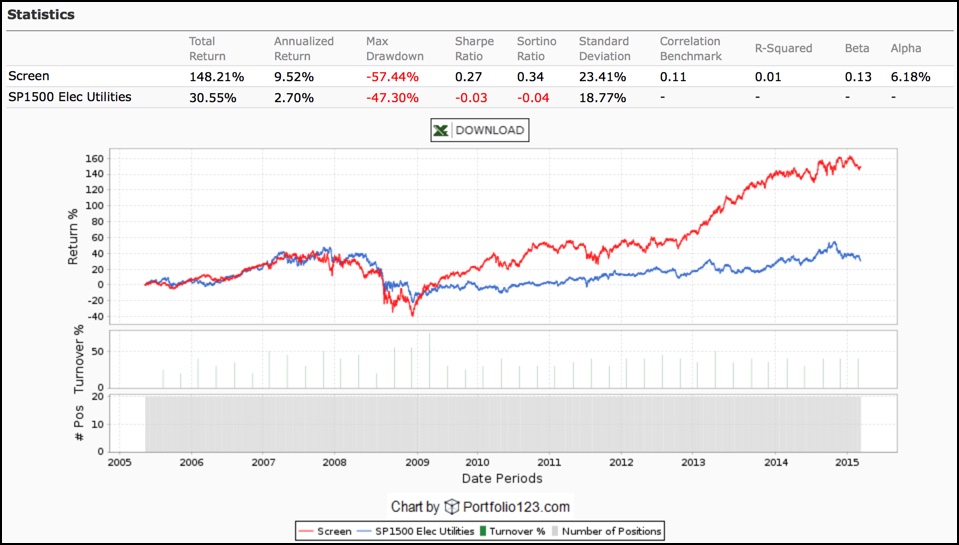
Even with a mental adjustment to add dividends to the benchmark, the portfolio still outperforms over the full ten-year period. But when it comes to performance, I think the other tests will be more relevant for us. This one is most interesting for the standard deviation of the portfolio. The 23.41% level we see here is considerably lower than the 36.32% level we saw in the last article with the ten-year test of the stocks at the very top of our target yield range. This is consistent with what we would expect to see if, as seems likely, the more finely-tuned strategy presented here has been more effective at limiting or avoiding volatility related to the reality or fear of dividend cuts.
The standard deviation we see here is above that of the electric-utility benchmark and I doubt a total return version of the benchmark would change that. But it’s in line with what I’ve seen for many other models with which I’ve succeeded in the real world. (If you compare this standard deviation with figures you may have seen elsewhere, for fund performance for example, bear in mind our figure is computed based on daily returns and will necessarily come higher than numbers computed based on monthly or quarterly returns.) The portfolios generated by this model do tend to include some electrical utilities but they often are not heavily weighted in this area. So it makes sense to see a portfolio standard deviation that’s more typical of what we see in the market at large, rather than in the electric utility area per se.
That said, the standard deviations are more aligned in the more recent test periods.
Speaking of the more recent test periods, these help paint a clearer picture of where this strategy fits in the overall context of mainstream (ex REITs and ex MLPs) yield-oriented equity investing. We’ll come to see it as something that could be used in conjunction with a portfolio of electric utilities, potentially through an ETF that specializes in the area.
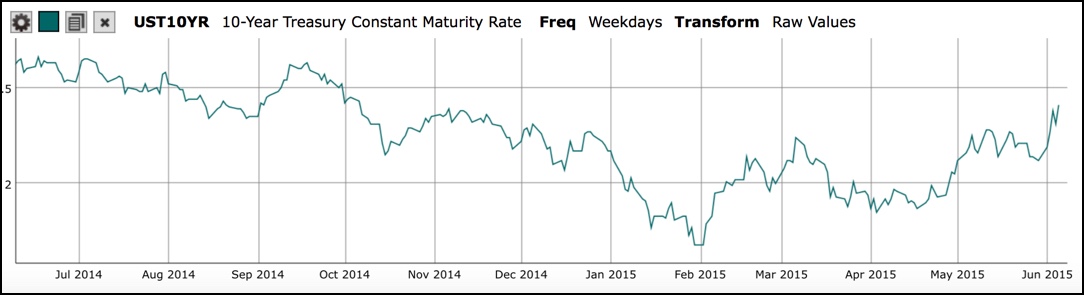
Let’s start with some context, a view of the trend in the 10-year Treasury rate over the past three years. (The data originates from FRED and the presentation comes from Portfolio123’s macro tool.)
Figure 3
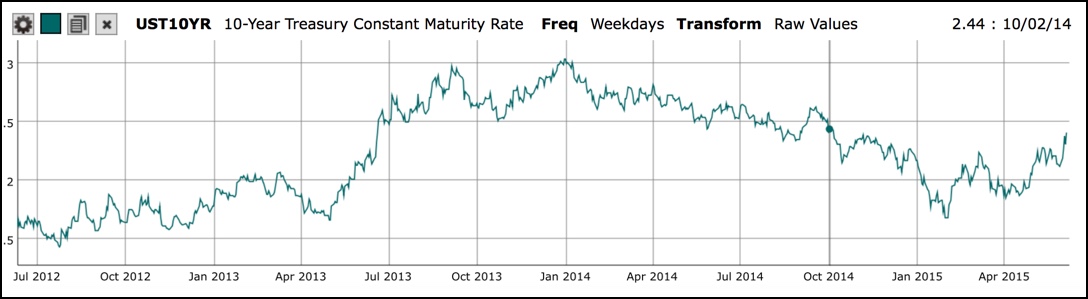
The economy throughout this period was more or less spinning its wheels and the rate throughout was pretty low. Yet the sub-periods are not identical to one another. We see an upward rare bias for the first half of the period., and the reverse later on.
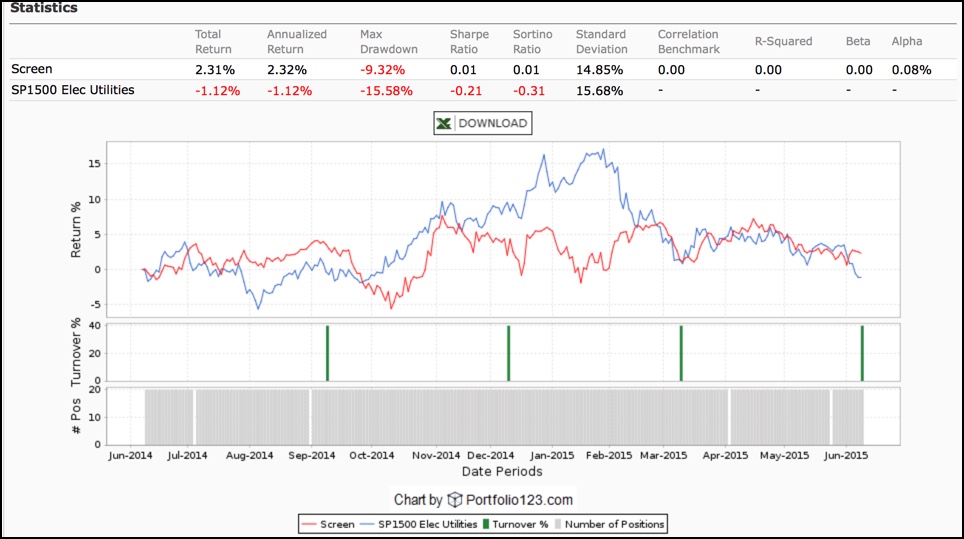
In that context, consider Figure 4, which shows that throughout the three-year period, the model left the benchmark in the dust (adding an assumed yield to the latter would not alter that conclusion).
Figure 4: The 3-Year Test
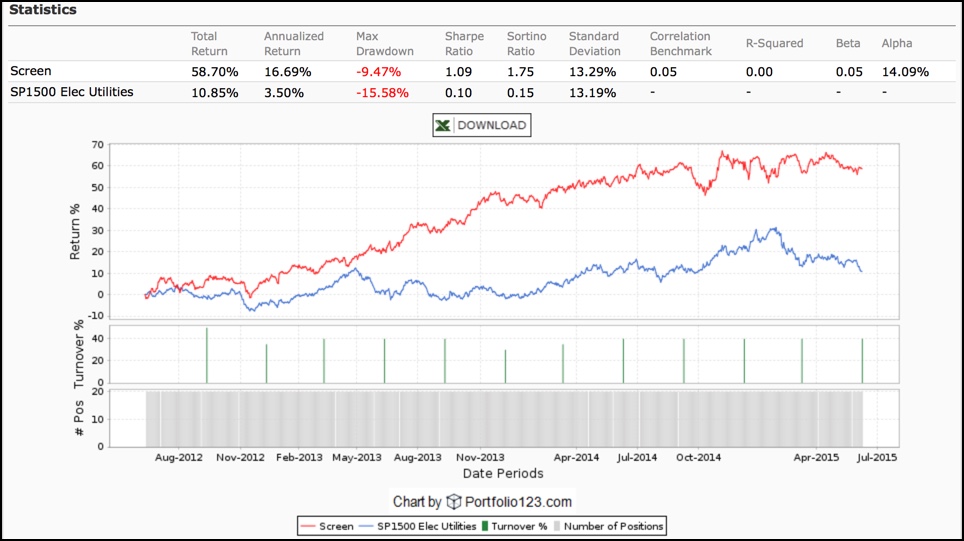
Notice, though, that during the latter part of the interval, when rates had a downward bias (until the very end), the model flattened out.
Figure 5 shows that over the most recent 12-month period, the model trailed the benchmark (again, remember to assume we have to add a yield to the index). The model didn’t get slaughtered, but it‘s easy for this period to argue in favor of an electric-utility ETF.
Figure 5: The 1-Year Test
But let’s not be too quick to view the year as an aggregate. Look at Figure 6, which shows the trend in the 10-year Treasury over the past year, and think of the period in terms of its parts.
Figure 6
Notice how the benchmark’s strength relative to the portfolio is most evident at times when rates fell (even if from incredibly low to incredibly lower). The electric-utilities seem more rate-sensitive than the portfolio. That’s supported by the brief test the interest-rate scare to which the market reacted in mid-2013. (Adding a yield to the benchmark would not enable it to keep up with the portfolio.)
Figure 7: The Mid-2013 Test
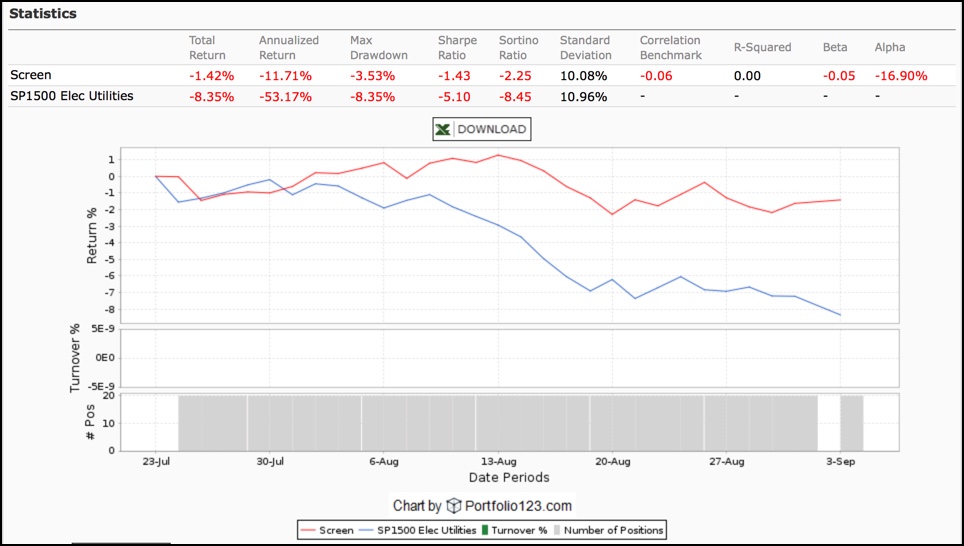
Less interest-rate sensitivity, if it turns out to be a sustainable feature of this portfolio, would likely be a good thing going forward if rates rise due to stronger economic activity.
Suppose, on the other hand, we just remain in the scraping along in mediocrity that characterized the recent past. That could argue slightly in favor on an electric-utility ETF. But we might not want to go all the way there. Such an environment would also likely be characterized by much rhetoric and concern about imminent rate increases and perhaps a few more rate panics such as we experienced in 2013. That suggests the most prudent course of action would be to use stocks such as those uncovered through this model as a supplement to basic electric utility exposure, such as through iShares Select Dividend ETF (DVY), which seems a bit more dividend-growth oriented than the S&P benchmark given its lower yield (3.13% at present).
The Stocks
So at long last, here is the current list of stocks.
Figure 8
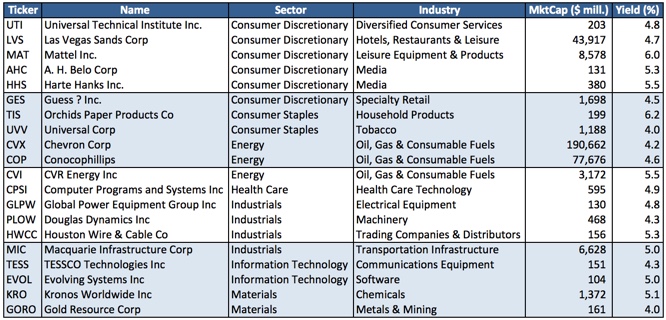
We don’t plan on marrying any of them. On average, about eight stocks out of 20 have been sold every three months during the course of the 10-year test. So I have to assume we’ll be ditching about that many (40% of the portfolio) in September.
How much trading is too much? That depends on you and your brokerage arrangement. Speaking for myself, I trade income stocks through my FolioInvesting.com account and, hence, give myself the luxury of not caring about how much I turn the portfolio over. I can, therefore, simply own the entire list. (And I actually do own a list produced by a similar models; I’ll find out the extent of overlap when I compare tickers for purposes of the disclosure.) If you have to care about turnover, then 20 selections from a well-conceived model is a good source of candidates for case-by-case individual stocks study.
Disclosure: Long CVX, MIC, CPSI.


