
Markets Break Out But Risks Remain
Early Wednesday morning I penned a “Quick Take” discussing the breakout of the two-month long consolidation process. To wit:
“The bulls are ‘attempting a jailbreak’ of the ‘compression’ that has pressured markets over the last two months.
This breakout will provide a reasonable short-term trading opportunity for portfolios as I still think the most probable paths for the market currently are the #3a or #3b pathways shown above.
If we get a confirmed break out of this ‘compression range’ we have been in, we will likely add some equity risk exposure to portfolios from a ‘trading’ perspective. That means each position will carry both a very tight ‘stop price’ where it will be sold if we are wrong as well as a “profit taking” objective if we are right.”
On Thursday, that “jailbreak” occurred with a move above resistance and the previous closing high downtrend.
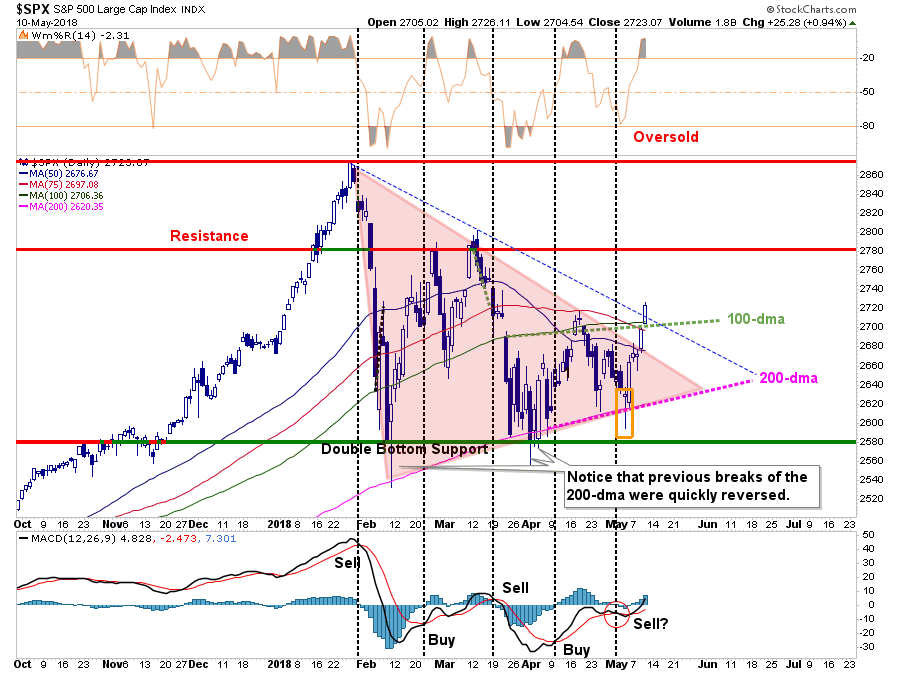
From a bullish perspective there are several points to consider:
- The short-term “sell signal” was quickly reversed with the breakout of the consolidation range.
- The break above the cluster of resistance (75 and 100-dma and closing high downtrend line) clears the way for an advance back to initial resistance at 2780.
- On an intermediate-term basis the “price compression” gives the market enough energy for a further advance.
With the market close on Friday, we do indeed have a confirmed breakout of the recent consolidation process. Therefore, as stated previously, we reallocated some of our cash back into the equity side of our portfolios.
From a bearish perspective the are also several points to consider:
- The volume and breadth of the market rally has been “okay” but not stellar, which suggests this was more of a forced “short-covering” rally than a turn in overall conviction.
- The rally, as Doug Kass notes below, was led by a surge in energy prices due to the Iran escalation over the nuclear agreement.
- With everyone seemingly short the U.S. dollar, short Treasury bonds and long oil prices, a reversal of that excess positioning seems likely from a contrarian point of view. Such would definitely pressure stock prices lower.
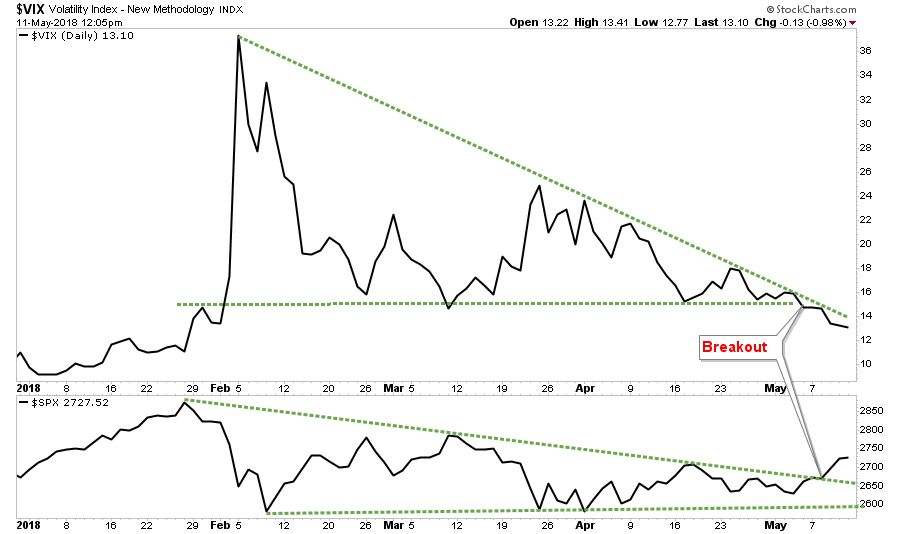
- Complacency has once again returned to the market very quickly following such a long consolidation process as noted in the chart below, not only is there a breakout in stocks but also volatility.
As I noted in last Tuesday’s update:
“Despite the recent corrective process, investors still remain primarily allocated to equities as shown by the Rydex allocation measures below. With the market testing its longer-term bullish trendline from the 2016 lows, Rydex Bear and Cash allocations remain at low levels while bullish allocations have not fallen much from their recent highs.”
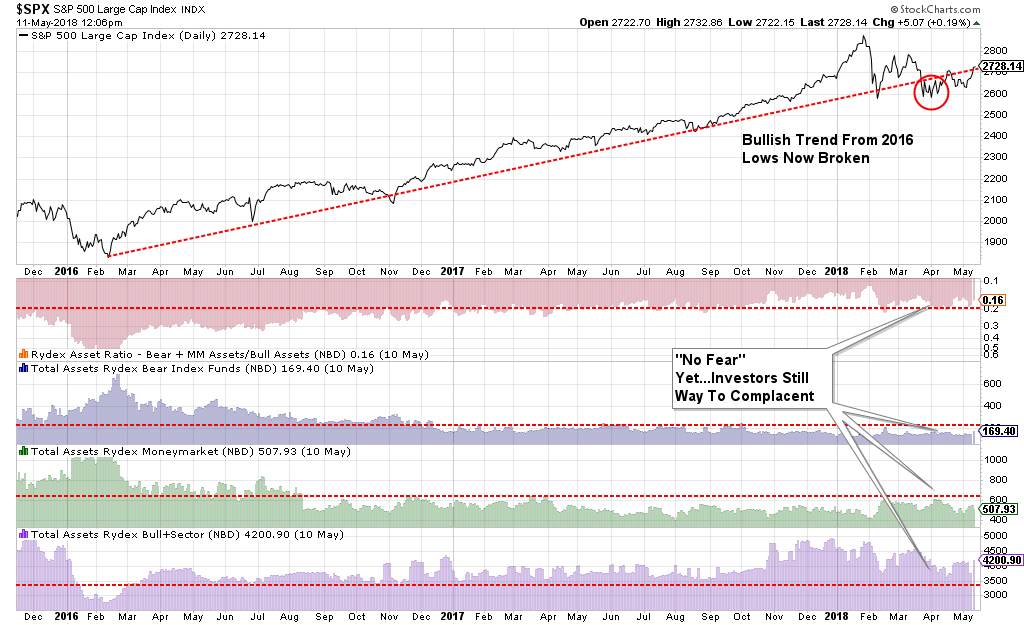
What is clear is there was actually very little “capitulation” by investors over the last couple of months which potentially limits any advance in the markets from current levels.
But, while “everyone loves a good bullish thesis", let me restate the reduction in the markets previous pillars of support:
- The Fed is raising interest rates and reducing their balance sheet.
- The yield curve continues to flatten and risks inverting.
- Credit growth continues to slow suggesting weaker consumption and leads recessions
- The ECB has started tapering its QE program.
- Global growth is showing signs of stalling.
- Domestic growth has weakened.
- While EPS growth has been strong, year-over-year comparisons will become challenging.
- Rising energy prices are a tax on consumption
- Rising interest rates are beginning to challenge the valuation story.
“While there have been several significant corrective actions since the 2009 low, this is the first correction process where liquidity is being reduced by the Central Banks.”
Be Careful Where You Step
As I stated last week:
“In reviewing our three primary pathways above, pathway #3a and #3b remain the most viable currently.
- Pathway #1 is the most bullish of potential outcomes. With earnings continuing next week, and short-term conditions mildly oversold, the market is able to push through resistance and rally back towards old highs. (Probability = 20%)
- Pathway #2 is the most bearish with the market failing at the cluster of overhead resistance once again but this time violating the 200-dma. This decline begins a process of a deeper correction as we head into the summer months. (Probability = 30%)
- Pathway #3a and #3b suggest a further rally to the 100-dma, a pullback to the previous downtrend and then either an advance that breaks above the 100-dma and begins a more bullish rise, OR a failure and another test of the 200-dma. (Probability =50%)“
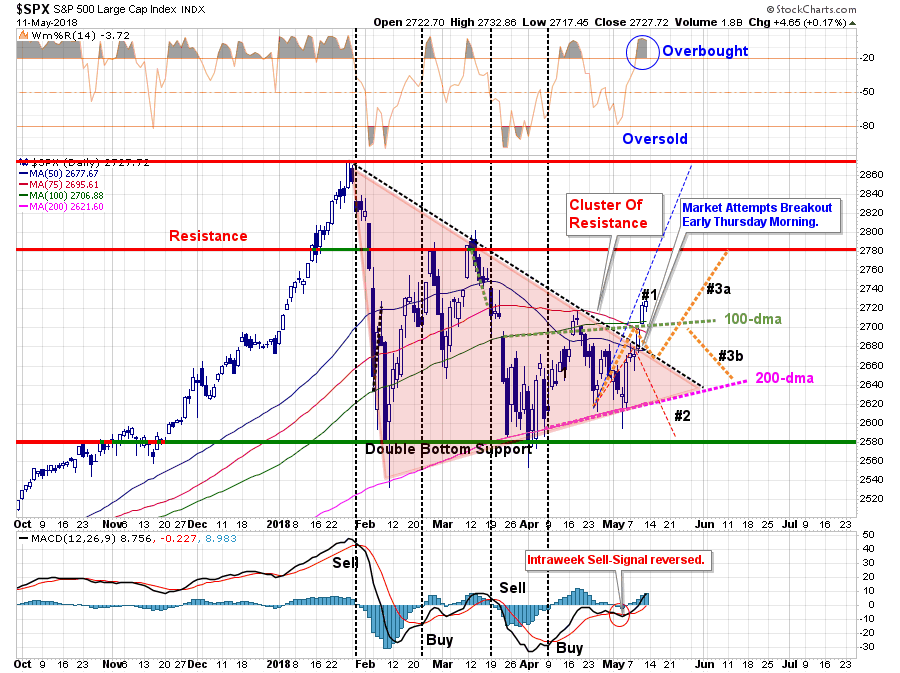
While we have been giving the most weight to a version of pathway #3, it was pathway #1 that came to fruition, at least for now. Over the next week, I will begin to map out the next three most probable paths as #2 and #3b have likely been invalidated unless we get a sharp breakdown next week.
On an intermediate-term basis, both of our weekly “sell signals” remain, and as shown below, despite the sharp rally last week, the market remains confined within an intermediate-term consolidation process.

While the break above the previous resistance and moving averages is indeed “bullish” in the short-term, the intermediate-term setup is not as favorable just yet. When, and if, the current “sell signals” reverse, then becoming much more aggressively allocated will make sense.
For now, be careful where you step.
Follow Market Strength At Your Own Peril
It is this longer-term backdrop which keeps us cautious for now, and while we are “trading” the short-term breakout in our portfolios, we are well aware of the more deteriorating conditions on a long-term basis.
As my friend Doug Kass so aptly penned last week.
“I like to write that buyers live higher and sellers live lower because of the structural change in our markets in which passive strategies (quant strategies like volatility trending, risk parity and ETFs, etc.) now dominate over active strategies (hedge funds and mutual funds).
But so do non-passive strategies and far too many retail investors – many of whom worship at the altar of price momentum – buy higher and sell lower. And so do strategists and “talking heads” too often bend with the market winds.
Personally, I don’t think a lot on my bearish checklist has changed since the Spyders (SPY) made another successful test at about $259 only a week or so ago and now are trading at $272. Prices have risen and reward versus risk has eroded.
I continue to look for a down second half of the year.
The political, geopolitical, economic and corporate profit concerns which I have highlighted over the last several months remain very much intact. So does the outlook for interest rate risks, inflation and other fundamental issues present headwinds to a new Bull Market leg.
My view is that the market and economic cycle are maturing.
Rather, I prefer to be opportunistic in the new regime of volatility – buying when others are fearful and stocks are at the lower end of my trading range and selling (now) when others are greedy and stocks are at the upper end of my trading range.
With S&P cash now at around 2720, against an estimated near-term trading range of 2550-2725, a broader projected range over the balance of 2018 at 2200-2850 with a “fair market value” projected at about 2400 — the upside reward versus the downside risk has once again turned negative in all three of these calculations:
- Within the context of the short-term trading range (2550-2725) there is limited upside and about 165 S&P points of downside.
- Looking at “fair market value” (2400) versus the top end of the 2018 trading range (2850) there is upside of about 130 S&P points compared to 320 S&P points of risk – for a negative ratio of 2.4x.
- Finally, when viewed against the low end of the full year range (2200) and the top end (2850) there is upside of only 130 S&P points and downside risk of 520 points – for a negative ratio of 4x.
- Let some rationalize the advance and grow more bullish, just as they rationalized the decline (and grew bearish). Though I have enjoyed the ride recently and while I am still net long in net exposure, my foot is now off the accelerator (as discussed in this morning’s opener) as I approach a tactical market exit (likely through defined risk puts).
As always I approach my market view without the sort of hubris and self-confidence that many conduct themselves – recognizing that the only certainty is the lack of certainty and that I do not have a concession on the truth.
I recognize my infallibility especially as it relates to Mr. Market – who often punishes the most and brightest investors at its whim.
I deal with probabilities, not relative strength.
Here are my core observations and current views:
- Investor sentiment is growing more bullish with higher prices and investor complacency is now swelling
- In a market dominated by passive and momentum based strategies – buyers live higher and sellers live lower
- Mr. Market may be approaching the top end of an intact trading range – and reward vs risk has, again, deteriorated
- We are in a new regime of volatility that will likely reign over the balance of the year
- We remain in a trading sardine market and not an eating sardine market
- With machine/algo domination I am giving Mr. Market a wider berth in my trading strategy – that is to say that I am not trying to capture every zig and zag
- I may be wrong!
Moreover, and importantly, the most recent leg higher has been led by energy stocks –historically a signpost of caution and another possible arrow for the Bearish cabal.”
While we are more “reactive” than “predictive,” I couldn’t agree with Doug’s sentiment more. We are long-term investors and seek to buy “value” when such is present.
Currently, value is a scarce commodity so we remain both patient and highly sensitive to the risk of a bigger correction action coming in the months ahead.
Just to be clear, we have modestly increased equity exposure, but we do so from a “trading” perspective with very tight “stop-loss” levels while we still continue to hold a higher level of cash. If the market repairs itself and begins to resume its “bullish trend", these “trades” will become “investments” over a longer-term time horizon and we will use our stored cash to continue to build into things that are working.
We follow one of the simplest rules for successful investing:
“Do more of what works and less of what doesn’t.”
Market & Sector Analysis
Data Analysis Of The Market & Sectors For Traders
S&P 500 Tear Sheet

Performance Analysis
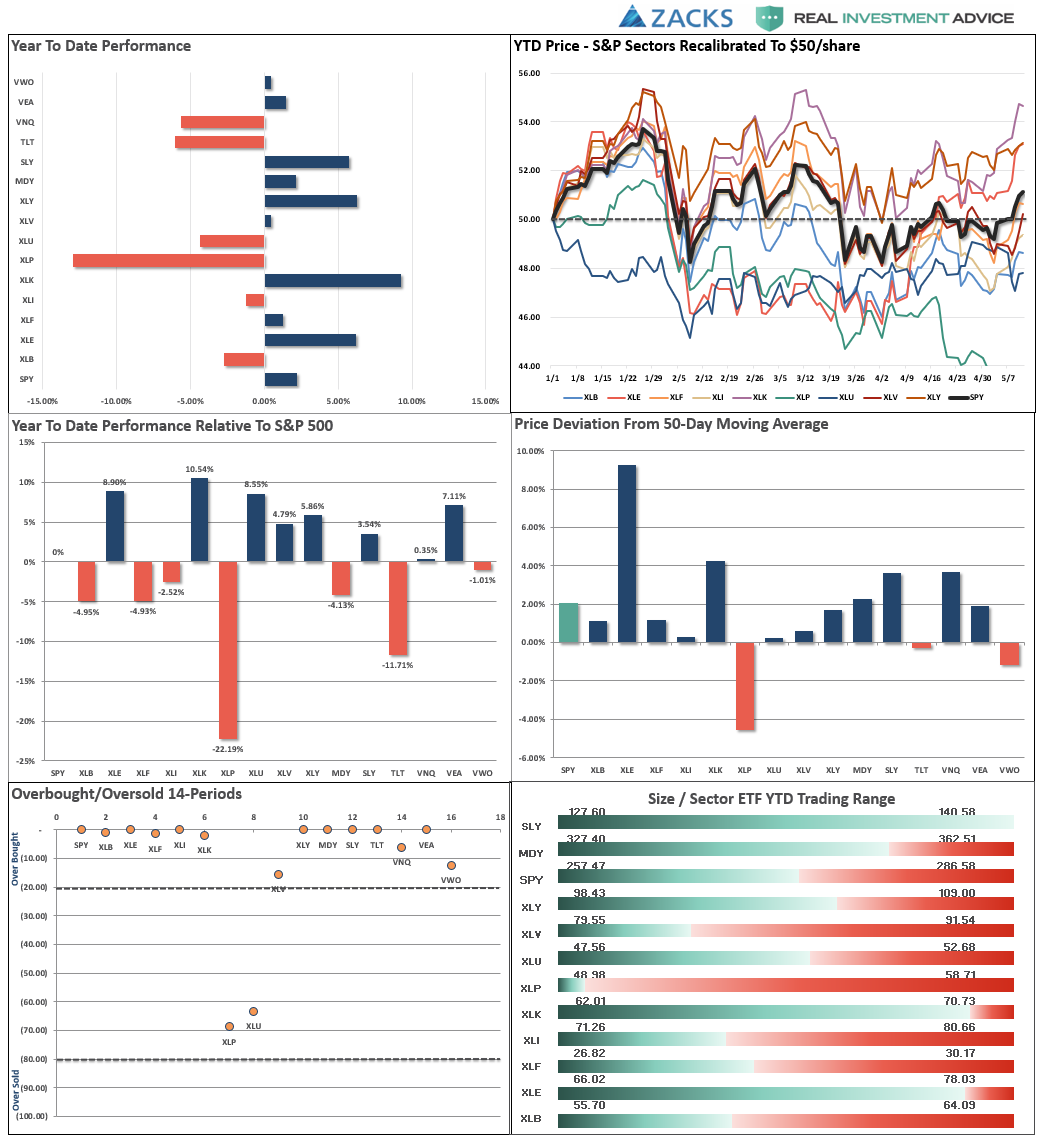
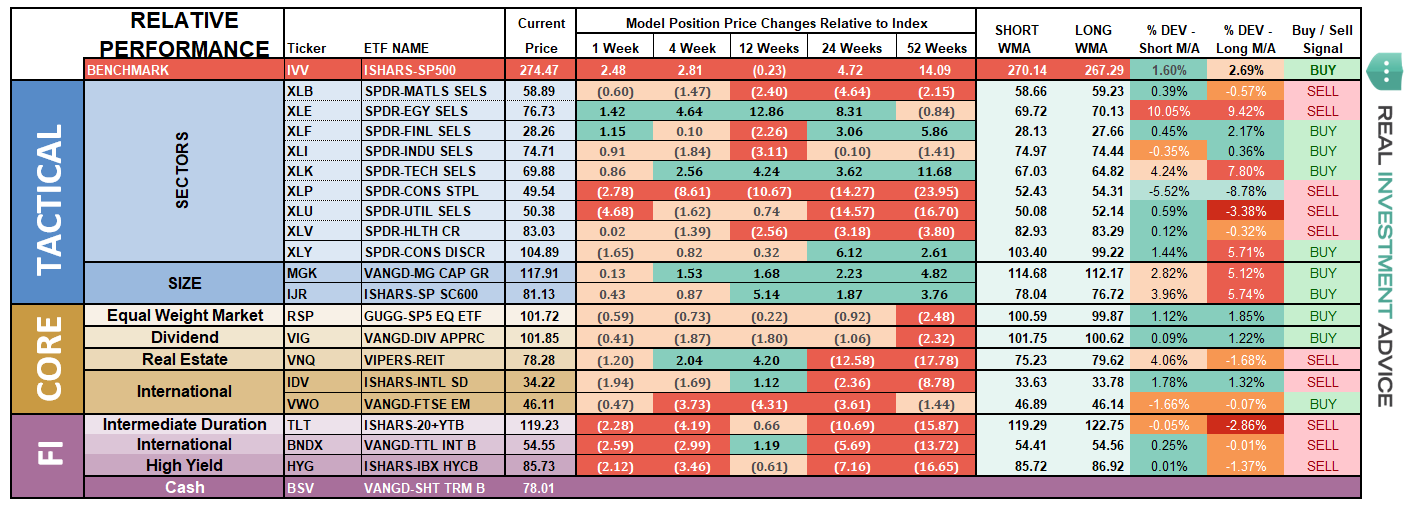
ETF Model Relative Performance Analysis
Sector & Market Analysis:
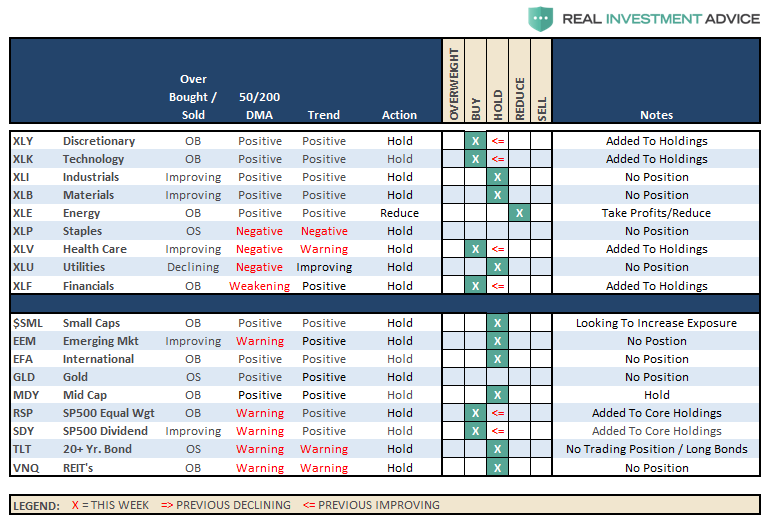
As noted above, the breakout this past week of the ongoing consolidation process is indeed bullish for the markets on a very short-term basis. Also, as noted, we did moderately increase exposure to a few areas of the market from a “trading” perspective currently.

Discretionary, Technology, Industrials, Materials, Energy, Health Care, and Financials all moved back above their 50-dma this past week. Technology, Discretionary and Energy and Financials are also very overbought short-term. We added some exposure this past week to Technology, Discretionary, Health Care and Financials.
Staples – There is a potential rotation trade being built in this sector. It is too soon to buy into staples just yet, but we may be getting close to a decent trading opportunity. We are watching closely particularly as we move into the summer months.
Utilities dropped back to the bottom of their upward trading range this past week. The sector remains both a hold for now as well as “underweight” in portfolios.
Small-Cap and Mid Cap performed well during last week’s advance with small-caps leading the charge. The break above the triple-top for small-caps put us in a position to add to the sector on any weakness next week.
Emerging and International Markets remain lackluster in terms of performance currently. We previously removed our holdings in these markets and remain domestically focused at the moment. We will continue to monitor performance for opportunity if it presents itself.
Dividends and Equal weight continue to hold their own and we continue to hold our allocations to these “core holdings".
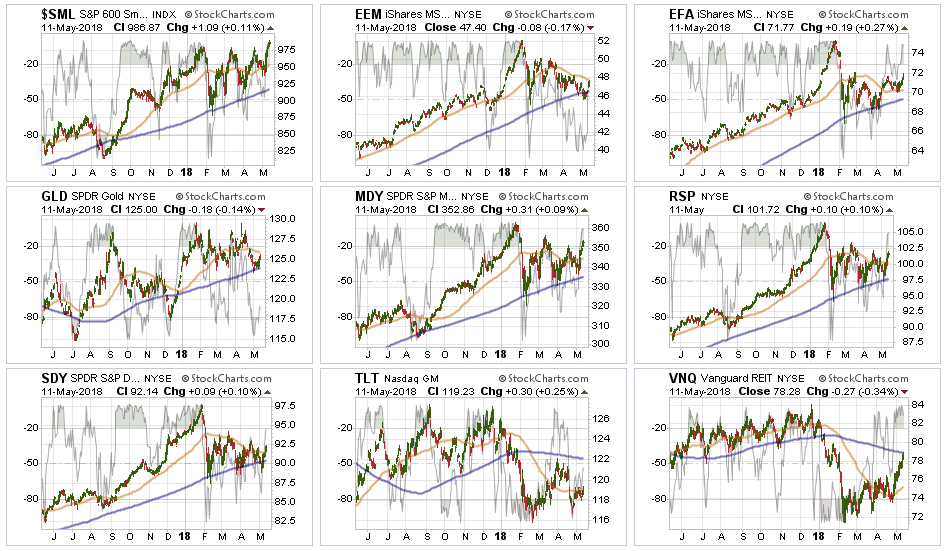
Gold continues its volatile back-and-forth trade but remains confined below a massive level of multi-top resistance. We currently do not have exposure to gold, and have been out for a long-time, but if you are already long the metal hold for now. $123 on GLD is a hard stop.
Bonds and REITs – last week interest rates peaked over 3% for just a brief moment before plummeting back to earth again. There are two things happening that are supportive to bonds currently. Prices are beginning to build an uptrend of higher lows, a break above recent highs should move bond prices pack towards the 200-dma. Such would likely coincide with a failed market breakout which remains a likely possibility. REIT’s, on the other hand, broke above their recent uptrend and rocketed towards their 200-dma. While very overbought short-term, any correction that maintains the breakout will allow us to add REIT’s back into models.
The table below shows thoughts on specific actions related to the current market environment.
(These are not recommendations or solicitations to take any action. This is for informational purposes only related to market extremes and contrarian positioning within portfolios. Use at your own risk and peril.)
Portfolio/Client Update
Over the last several weeks, we have continued to maintain higher levels of cash than normal as market volatility had markedly increased. This past week, as noted in the main body of the newsletter, we broke out of the consolidation range which should provide the market with some upside in the short-term. From a portfolio management perspective, we are using this breakout to put some of our excess cash weightings back to work as follows:
- In our ETF model portfolios were are adding weight to Discretionary, Technology, Health Care and Financials as well as our “core” holdings. In existing accounts, we are simply rebalancing to target weights in these holdings. For new accounts, we are moving into the on-boarding process by adding 50% of target weights.
- In Equity model portfolios we have added 50% to our target weights in our targeted companies. We will add the other half on weakness in the market which does not violate the bullish trend.
- The same goes for our Equity/Option Collar portfolio. Once we complete the position purchases we will then collar each position with a “cashless collar” to hedge exposure.
- The same positioning applies to the Equity/ETF blended model with 50% of target weights being added for new accounts and rebalancing to target for existing portfolios.
We continue to honor the current “bullish trend", but also remain very aware of the risks. As stated in the newsletter, all actions over the past week are “trading positions” with very tight stops and risk management processes in place.
If the market fails we raise cash and add hedges. If not, these “trading positions” will become longer-term “investments".
As noted last week, the rally remains weak and lacks real conviction. But as we noted then:
“If the market can break above the current downtrend channel on heavy volume, confirming a breakout, we will reallocate and rebuild portfolio models accordingly.”
It did and we are.
That is the process we follow. But it doesn’t mean we have to “like it".
However, “not liking” something is an “emotional bias” that we must keep in check through our discipline and strategy.
We remain keenly aware of the intermediate "sell signal" and we will continue to take actions to hedge risks and protect capital until those signals are reversed.
THE REAL 401k PLAN MANAGER
The Real 401k Plan Manager – A Conservative Strategy For Long-Term Investors

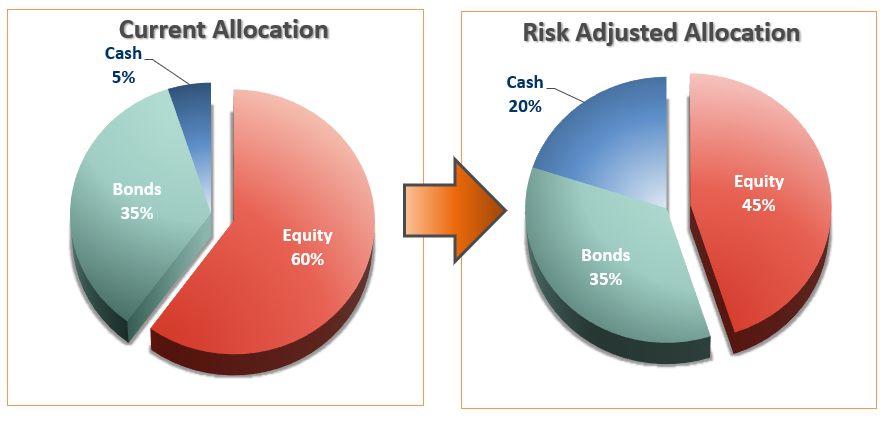
There are 4-steps to allocation changes based on 25% reduction increments. As noted in the chart above a 100% allocation level is equal to 60% stocks. I never advocate being 100% out of the market as it is far too difficult to reverse course when the market changes from a negative to a positive trend. Emotions keep us from taking the correct action.

Breakout
The good news is the market broke out of its trading “compression” last week. The bad news is that longer-term “sell signals", as shown above, remain intact.
This keeps portfolios underweight equities at the moment as we have to respect both the signals as they exist but also remain cognizant of the “trading restrictions” that exist in most 401k-plans. Over the last couple of months, we have been recommending to reduce equity allocations as follows.
We have also, during that time, stated that:
“If you have already reduced equity exposure, just sit tight this week and let’s see what happens.”
This week:
- If you are new to reading the newsletter or have NOT taken any previous actions and are overweight equities in your plan – Do nothing.
- If you are slightly underweight equities in your plan – move to the RISK ADJUSTED allocation model.
- If you are very underweight equities in your plan – move 50% of the way toward the RISK ADJUSTED model.
While conditions have improved in the short-term, we are not out of the woods just yet. Remain aware of the risks and pay attention to your portfolios.
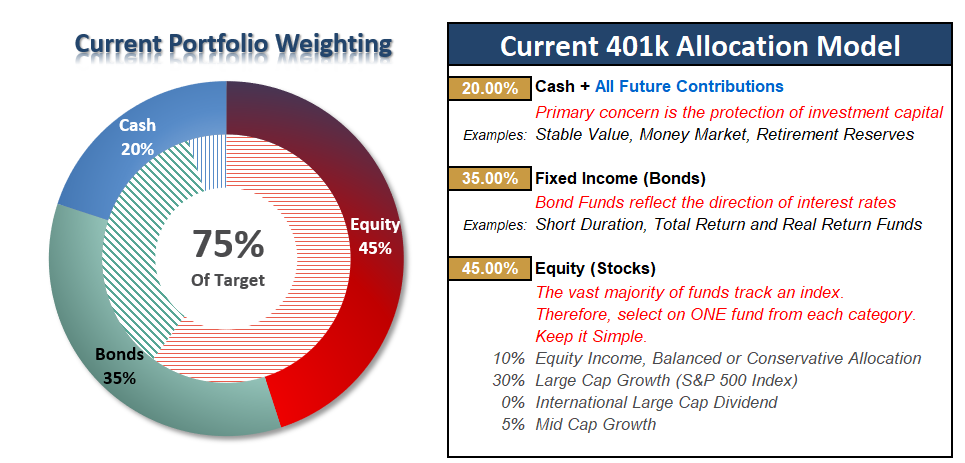
Current 401-k Allocation Model
The 401k plan allocation plan below follows the K.I.S.S. principle. By keeping the allocation extremely simplified it allows for better control of the allocation and a closer tracking to the benchmark objective over time. (If you want to make it more complicated you can, however, statistics show that simply adding more funds does not increase performance to any great degree.)
401k Choice Matching List
The list below shows sample 401k plan funds for each major category. In reality, the majority of funds all track their indices fairly closely. Therefore, if you don’t see your exact fund listed, look for a fund that is similar in nature.

Disclosure: The information contained in this article should not be construed as financial or investment advice on any subject matter. Real Investment Advice is expressly disclaims all liability in ...
more

