Understanding the foreign exchange market to the uninitiated seems like a tall order. Well we've some news, it's not only beginners who find it a taxing (no pun intended) matter. Indeed, those who specialize (or at least try to specialize) in financial analysis and currency trading, more often than not, struggle to consistently get on the right side of trades. However, that is by no means something which should put off the aspiring trader.
All those squiggly lines you see on traders' monitors are actually the bread and butter of trading. And truth be told, anyone can learn the ropes of reading and interpreting forex charts. Put simply, understanding the charts is essential if you want to pursue trading the currency markets, before you even consider forex indicators and systems. So, here are some tips if you're getting you're feet wet in charting:
1) Familiarize yourself with the different types of charts.
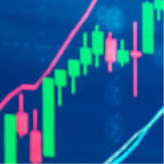
Various patterns illustrate charts, such as lines used for line charts, vertical bars for bar charts, candlesticks with a wick at each end for candlestick charts, and Xs and Os for point-and-figure charts. Trend lines keep track of the rise and fall of forex prices with inclining and declining lines. Triangle forex charts, on the other hand for example, show symmetrical patterns that break at the top when it's wise to buy, and break at the bottom when it's wise to sell. Note that the most popular charting format is known as Japanese Candlesticks, and if there's one type you want to get a hang of, this is the one.
2) Determine the time frame to follow.
A forex chart shows fluctuations over a variety of time periods. You can follow a one-day, four-hour or one-minute chart. Many forex systems trade with more than one time frame, so that you can make an accurate, "high probability" trade. However, some systems look for broader and bigger moves in the currency market - that is why they use only-one-time-frame daily systems. A lot of traders like to use a multi-timeframe approach, and this is definitely something which can give a trader an edge.
3) Maximize your layout by making sure it shows the correct and updated version of your preferred time frame.
Different timeframes project different forecasts; hence, it is a crucial factor in reading a forex chart. Hourly displays show a much bigger scenario in comparison to minute displays. Remember that market strategy and analysis depend on the time frame of the currency itself. It's no use saying, "GBPUSD is going up". It must always be related to a timeframe. A currency pair could be heading north on the Daily timeframe, but on a shorter five minute timeframe it could be heading south - it's all relative.
4) Look into the basic elements of a currency chart.
Currency charts show currency quotations laid out in pairs, with each pair bearing the same quotation. For example, for the currency pair EURUSD, the first part (EUR for Euro dollars) is the base currency, and the latter (USD for United States dollars) is the terms currency.
5) Keep in mind that a forex chart always quotes a currency pair in similar fashion.
For example, if the chart shows a fluctuating value for the EURUSD at 1.2345, it only means that every 1 EURO can buy 1.2345 USD. The face value of the currency pair is the base currency; in this case, 1 EURUSD is 1 EURO. Forex charts will show a two-dimensional price quotes - one is for the bid and the other is for the asking or offer. The bid price is lesser than the asking price. Purchase currencies based on the asking price.
6) Be aware of the latest geo-political events.
Remember, currency rates are the first indicators of economic changes. Politics play a big role in shaping the future of the market, so aside from forex charts analysis, it helps to keep a close watch on what's happening locally and globally, when thinking about your next move.
There are lots of charting platforms out there. Arguably when it comes to currency charts, the most popular platform is Metatrader, which is pretty decent for Japanese Candlestick charting. Once you've got a grasp of the charts and timeframes, and you think you're ready for the next step, you'll be inclined to look at some popular forex systems, to give you an idea of what elements go into making a decision to enter and exit a trade. This can help you form your own ideas and a set of rules and conditions you'd like to apply to your own trading, if and when you think you're ready.

