


For today's edition of our upgrade list, we used our website's advanced screening functions to search for UPGRADES to BUY or STRONG BUY with complete forecast and valuation data. They are presented by one-month forecast return. Hanwha Q-Cells, Blueprint Medicines, and Noodles and Co. are rated STRONG BUY. GOL-Linhas and Heritage Crystal are rated BUY.
|
Ticker |
Company Name |
Market Price |
Valuation |
Last 12-M Return |
1-M Forecast Return |
1-Yr Forecast Return |
P/E Ratio |
Sector Name |
|
HQCL |
HANWHA Q CELLS |
9.7 |
56.59% |
25.97% |
1.15% |
13.83% |
N/A |
Computer and Technology |
|
BPMC |
BLUEPRINT MED |
72.07 |
86.09% |
12.33% |
1.11% |
13.30% |
N/A |
Medical |
|
NDLS |
NOODLES & CO |
13.23 |
28.47% |
198.98% |
1.09% |
13.09% |
661.50 |
Retail-Wholesale |
|
GOL |
GOL LINHAS-ADR |
8.61 |
52.89% |
-5.76% |
0.60% |
7.25% |
29.69 |
Transportation |
|
HCCI |
HERITAGE-CRYSTL |
22.02 |
15.62% |
3.14% |
0.60% |
7.14% |
36.70 |
Industrial Products |
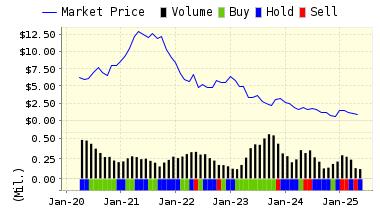
Today, we take a look at Noodles & Company (NDLS). Noodles & Company is a fast casual restaurant which offers lunch and dinner. It serves noodles, pastas, salads, soups, sandwiches, cheese, meatballs and beverages. The company operates in the United States. Noodles & Company is based in Broomfield, Colorado.
This stock has caught fire lately due to some timely analyst upgrades and a new product that many think will give the company an edge. Noodles is riding the low-carb and paleo craze by providing customers and alternative to high-carb traditional pastas. Many analysts think the company's zucchini noodles--known as "zoodles"--will help differentiate the restaurants and make consumers take notice.
ValuEngine updated its recommendation from BUY to STRONG BUY for NOODLES & CO on 2018-10-16. Based on the information we have gathered and our resulting research, we feel that NOODLES & CO has the probability to OUTPERFORM average market performance for the next year. The company exhibits ATTRACTIVE Momentum and Earnings Growth Rate.
|
ValuEngine Forecast |
||
|
Target |
Expected |
|
|---|---|---|
|
1-Month |
13.37 | 1.09% |
|
3-Month |
13.54 | 2.33% |
|
6-Month |
13.97 | 5.62% |
|
1-Year |
14.96 | 13.09% |
|
2-Year |
14.77 | 11.61% |
|
3-Year |
14.60 | 10.36% |
|
Valuation & Rankings |
|||
|
Valuation |
28.47% overvalued |
Valuation Rank(?) |
|
|
1-M Forecast Return |
1.09% |
1-M Forecast Return Rank |
|
|
12-M Return |
198.98% |
Momentum Rank(?) |
|
|
Sharpe Ratio |
-0.45 |
Sharpe Ratio Rank(?) |
|
|
5-Y Avg Annual Return |
-25.29% |
5-Y Avg Annual Rtn Rank |
|
|
Volatility |
56.79% |
Volatility Rank(?) |
|
|
Expected EPS Growth |
650.00% |
EPS Growth Rank(?) |
|
|
Market Cap (billions) |
0.37 |
Size Rank |
|
|
Trailing P/E Ratio |
661.50 |
Trailing P/E Rank(?) |
|
|
Forward P/E Ratio |
88.20 |
Forward P/E Ratio Rank |
|
|
PEG Ratio |
1.02 |
PEG Ratio Rank |
|
|
Price/Sales |
0.82 |
Price/Sales Rank(?) |
|
|
Market/Book |
20.38 |
Market/Book Rank(?) |
|
|
Beta |
-0.54 |
Beta Rank |
|
|
Alpha |
1.09 |
Alpha Rank |
|
