Microsoft stock (NASDAQ: MSFT) is reaching an important equal legs area around 75 – 83 coming from 2009 low . The video below explains what we expect the stock to do from there and how this will affect the rest of the market.
Microsoft is showing 3 swings from all time lows and approaching the equal legs area ( 75 – 96 ) where a correction can be seen, but the move from 2009 low could still extend further if it’s the 3rd wave of an impulsive 5 waves move that’s why it’s not recommended to sell it despite it’s reaching a multi-year extreme area.

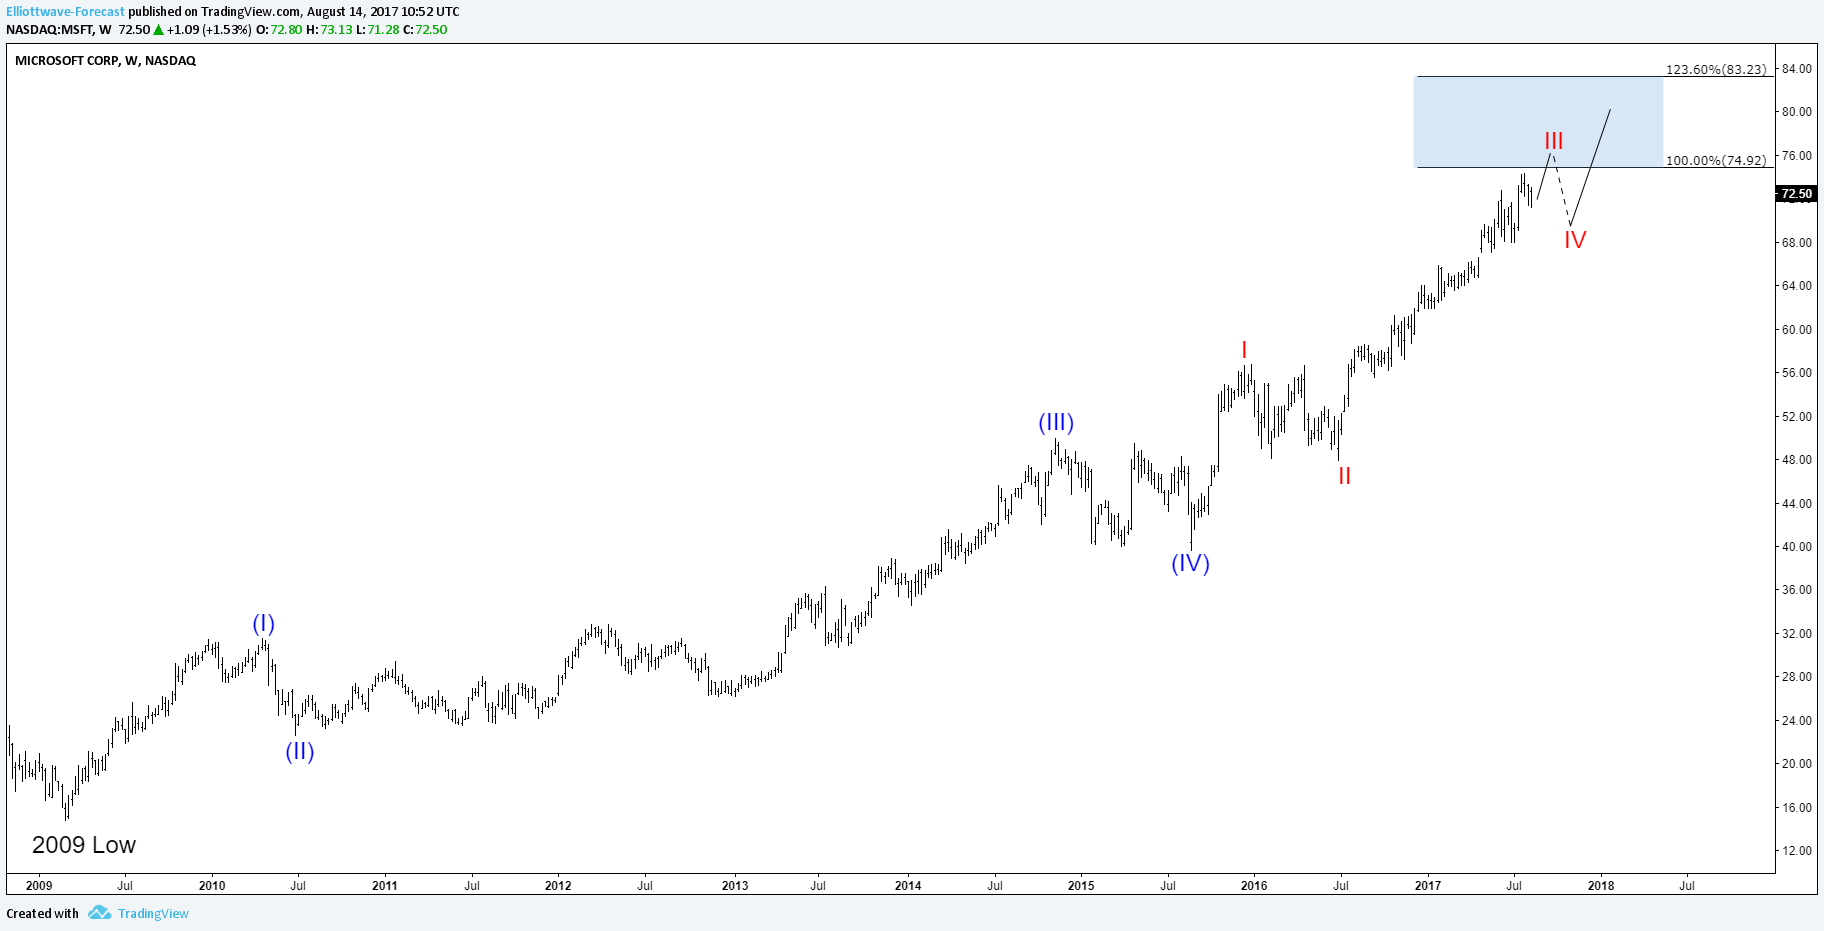
The cycle from 2009 low can be counted as an impulsive move with an extended 5th wave which still needs to end wave III then a pullback in IV before a final rally to end that cycle. This scenario is supporting more upside into the blue box area 74.92 – 83.23 and suggesting that pullbacks can still be bought in 3 , 7 or 11 swings.
Microsoft Daily Chart ( 5 waves )
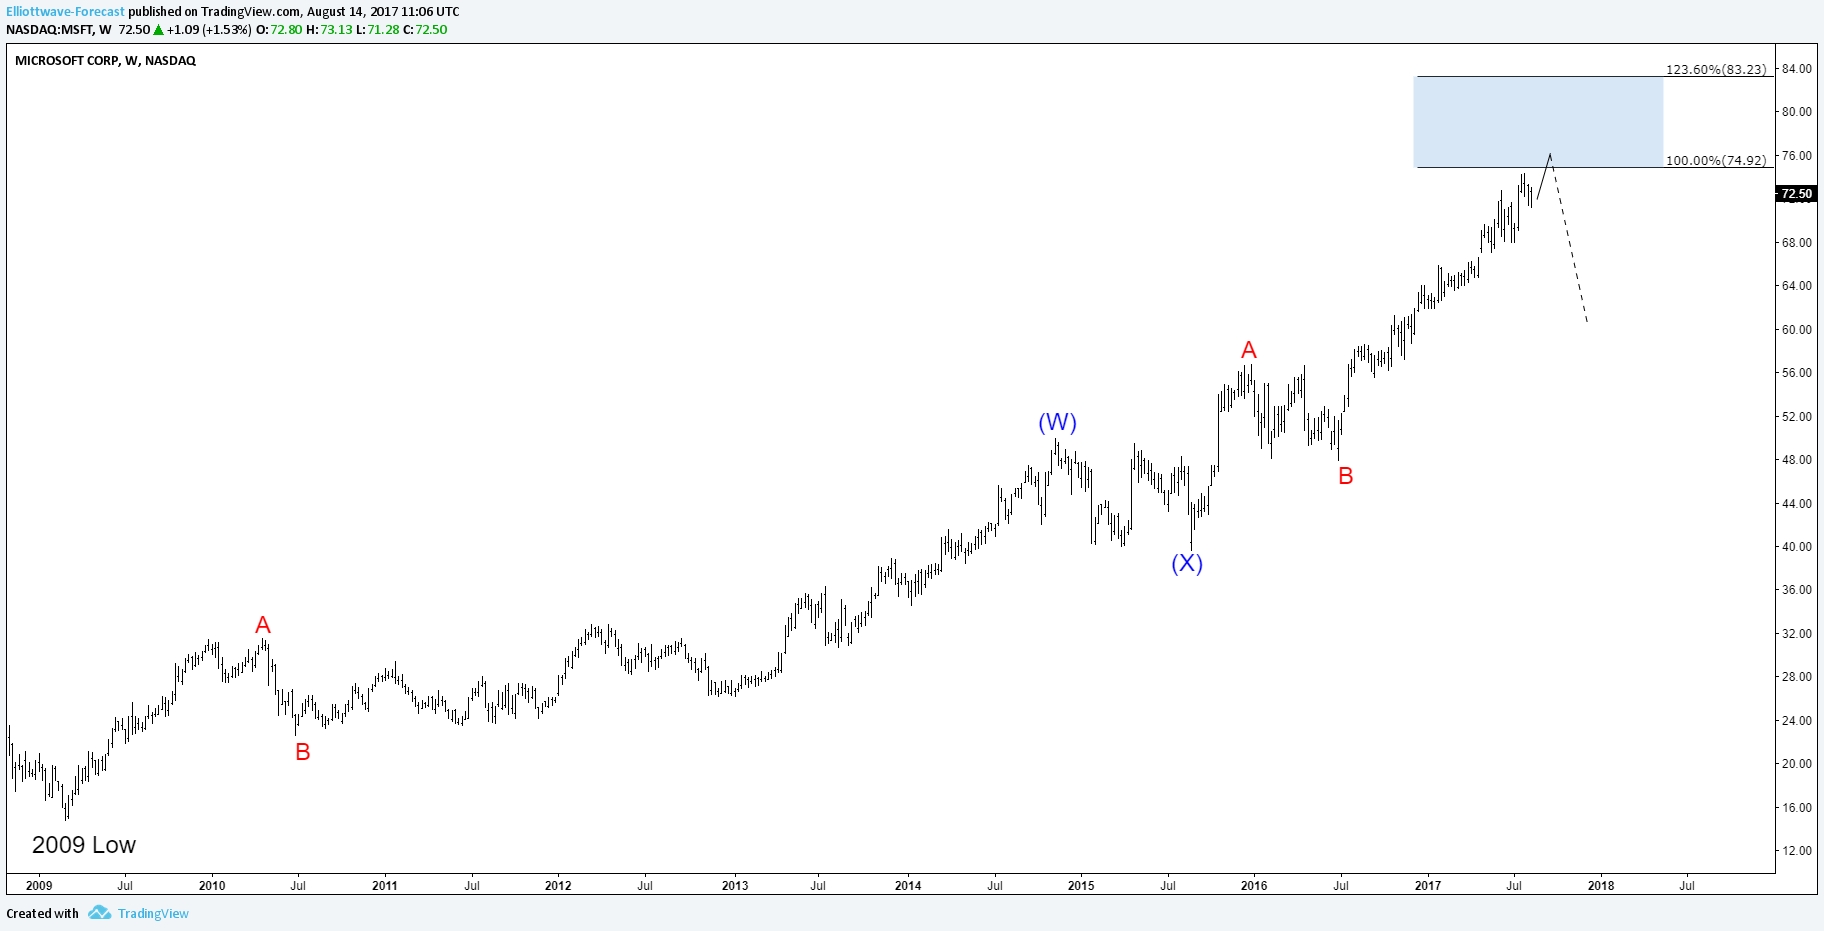
The second scenario is suggesting that MSFT is doing a double three 7 swings structure which also will be reaching equal legs area 74.92 – 83.23 and from there a pullback is expected to happen to correct that cycle.
Microsoft Daily Chart ( 7 swings )
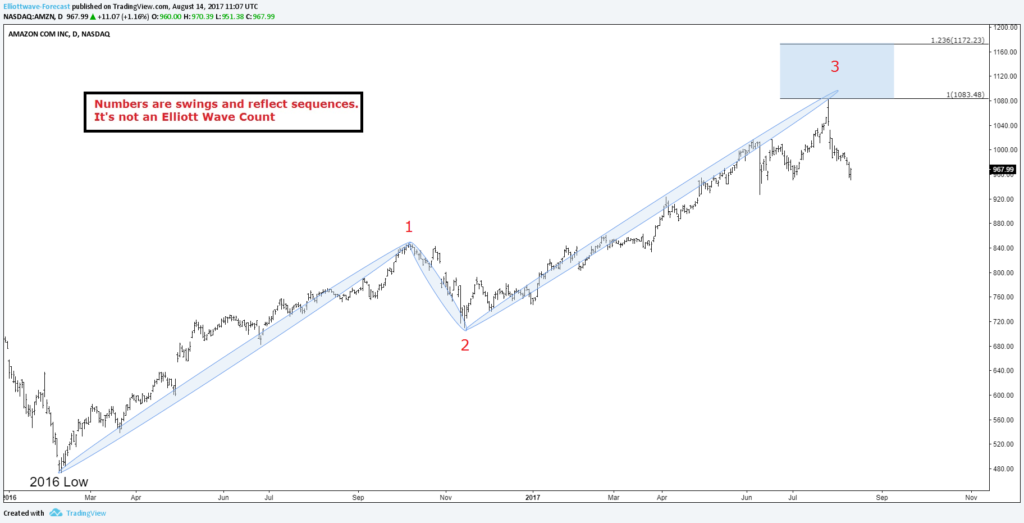
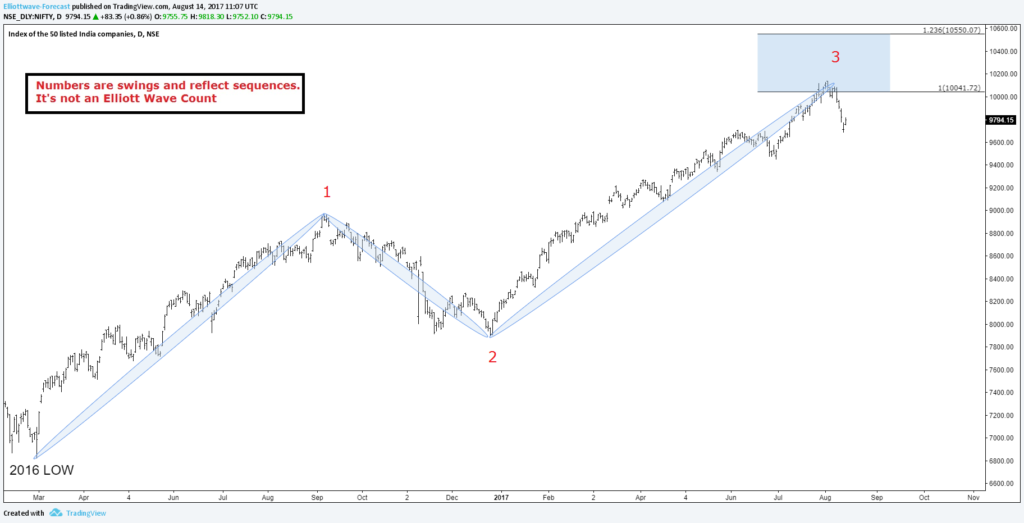
Consequently, both scenario presented above are indicating that Microsoft is reaching an important extreme area that could put pressure on the stock and produce a correction from there later on. Adding to that, we have Amazon stock and Nifty Index reached equal legs area from 2016 low which means that cycle is in bonus time if not already ended that’s why we need to be careful about chasing the long side in the stock market.
Amazon Daily Chart
NIFTY Daily Chart
Recap
Microsoft is one of the strongest companies and it’s heavily correlated to Nasdaq which already reached a similar area, so if we combine both instrument then we notice that there could be a choppy time ahead for the technology sector which will be also reflected on the rest of the market.
We are launching a new plan covering Stocks & ETFs , so if you’re interested in the future path of Tesla or any other instrument then take this opportunity and try our services 14 days for FREE to learn how to to trade forex, indices, commodities and stocks using our blue boxes and the 3, 7 or 11 swings sequence. You will get access to our 78 instruments updated in 4 different time frames, Live Trading Room and 2 Live Analysis Session done by our Expert Analysts every day, 24-hour chat room support and much more.