


In this Technical blog we are going to take a quick look at the past 1 hour Elliott Wave performance of the FTSE cycle from June 02, 2017 peak. Which we presented to our clients at elliottwave-forecast.com. We are going to explain the structure from that peak.
FTSE 4 Hour Elliott Wave Chart
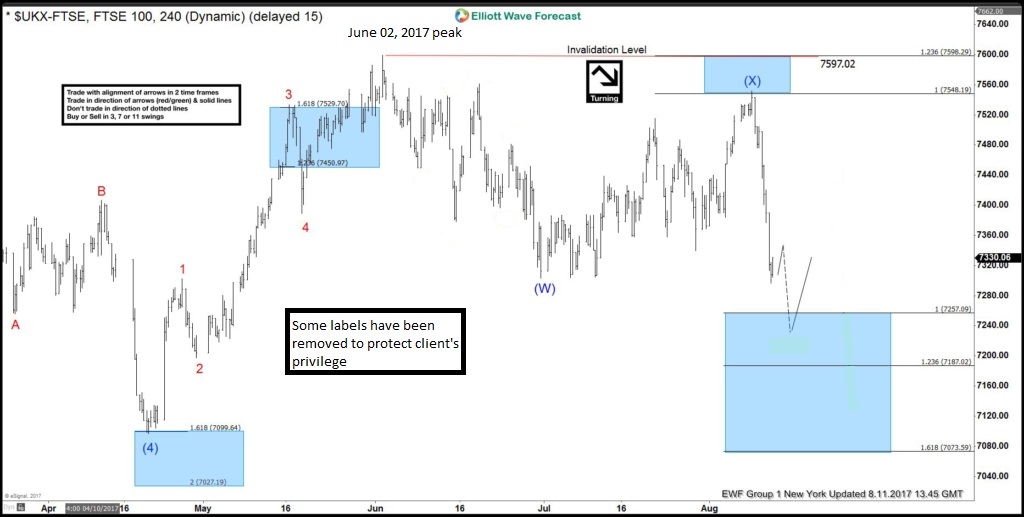
The Intermediate cycle from June 02 peak (7597) was showing 5 swings bearish sequences in the index. As the structure of the 8/02 looks to be overlapping, hence suggesting its corrective structure from the peak. Either W, X, Y or W, X, Y, Z. Where First leg lower, i.e. wave (W) ended in 3 swings 7297 & wave (X) bounce failed in between 7548-7598 100%-123.6% Fibonacci extension from (W) low. And resumes lower in wave (Y) lower towards 7257-7187 100%-123.6% Fibonacci extension area.
FTSE 1 Hour Elliott Wave Chart
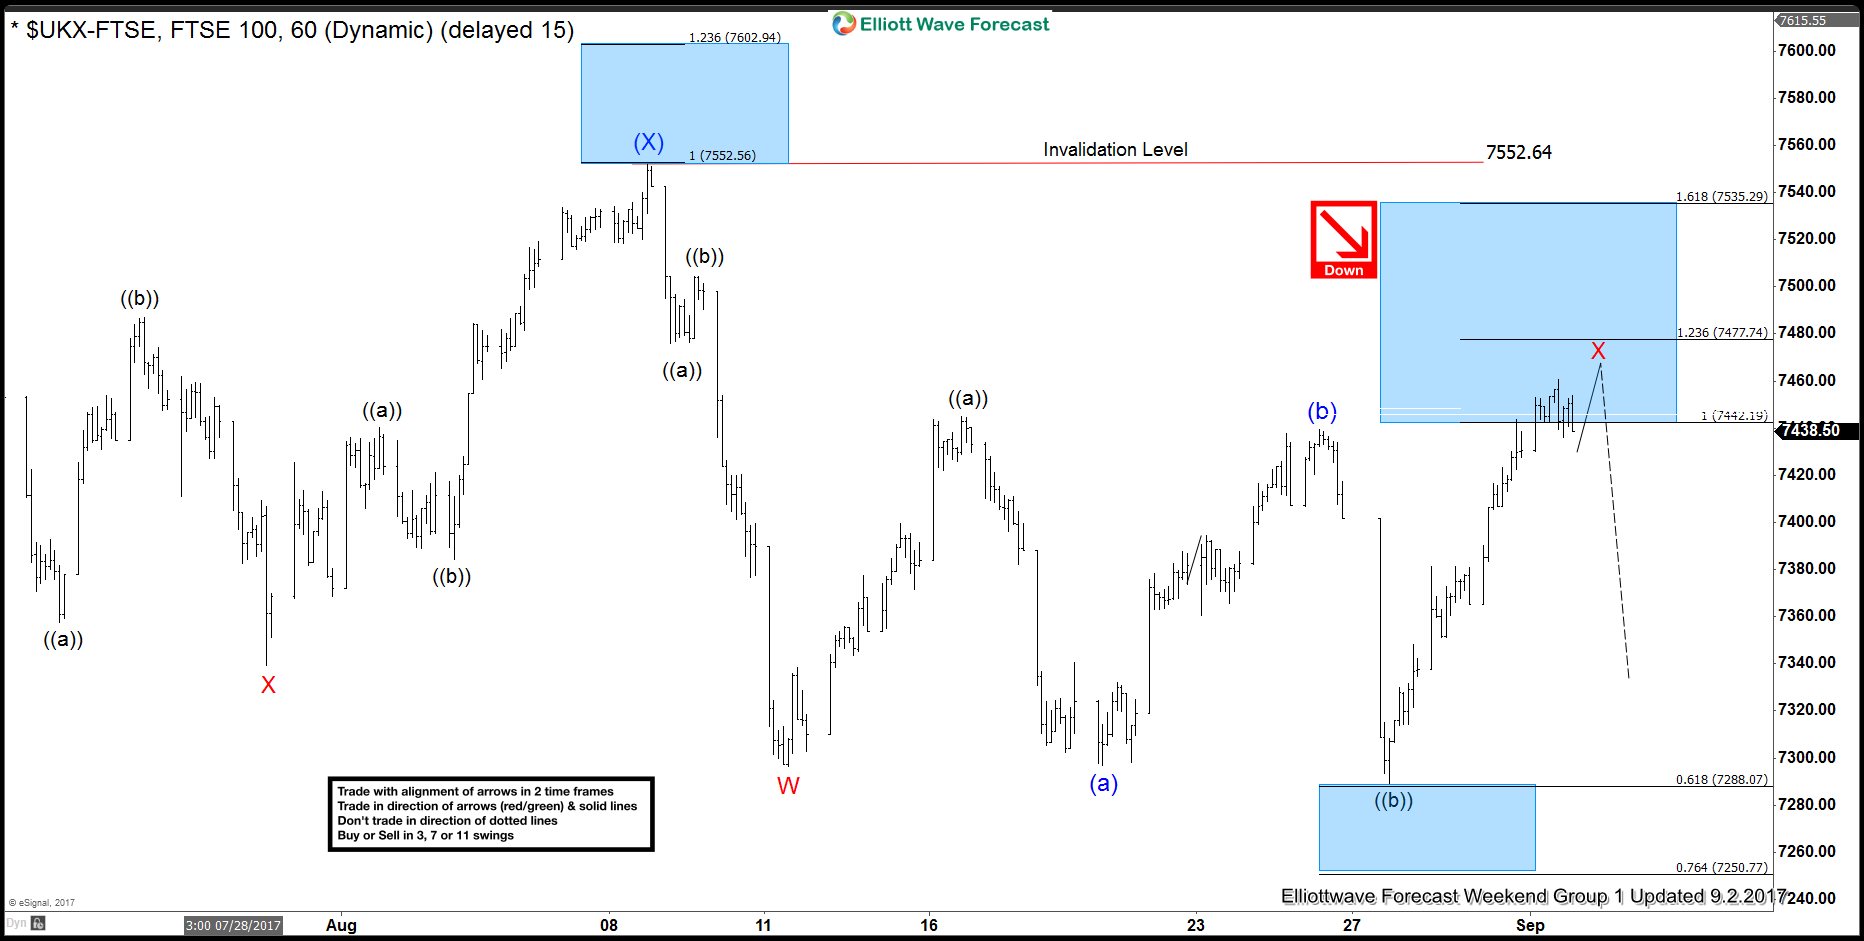
The intermediate bounce in wave (X) ended at 7552 peak and below from there internals oscillation of (Y) was also looks to be corrective in nature. Where Minor W of (Y) ended at 7287. Minor wave X was unfolded as Elliott wave Flat structure . Where Minute wave ((a)) ended at 7445. Minute wave ((b)) ended at 7283 low and Minute ((c)) of X was expected to end in between 7442-7477 100%-123.6% Fibonacci extension area of ((a)) – ((b)).
FTSE 1 Hour Elliott Wave Chart
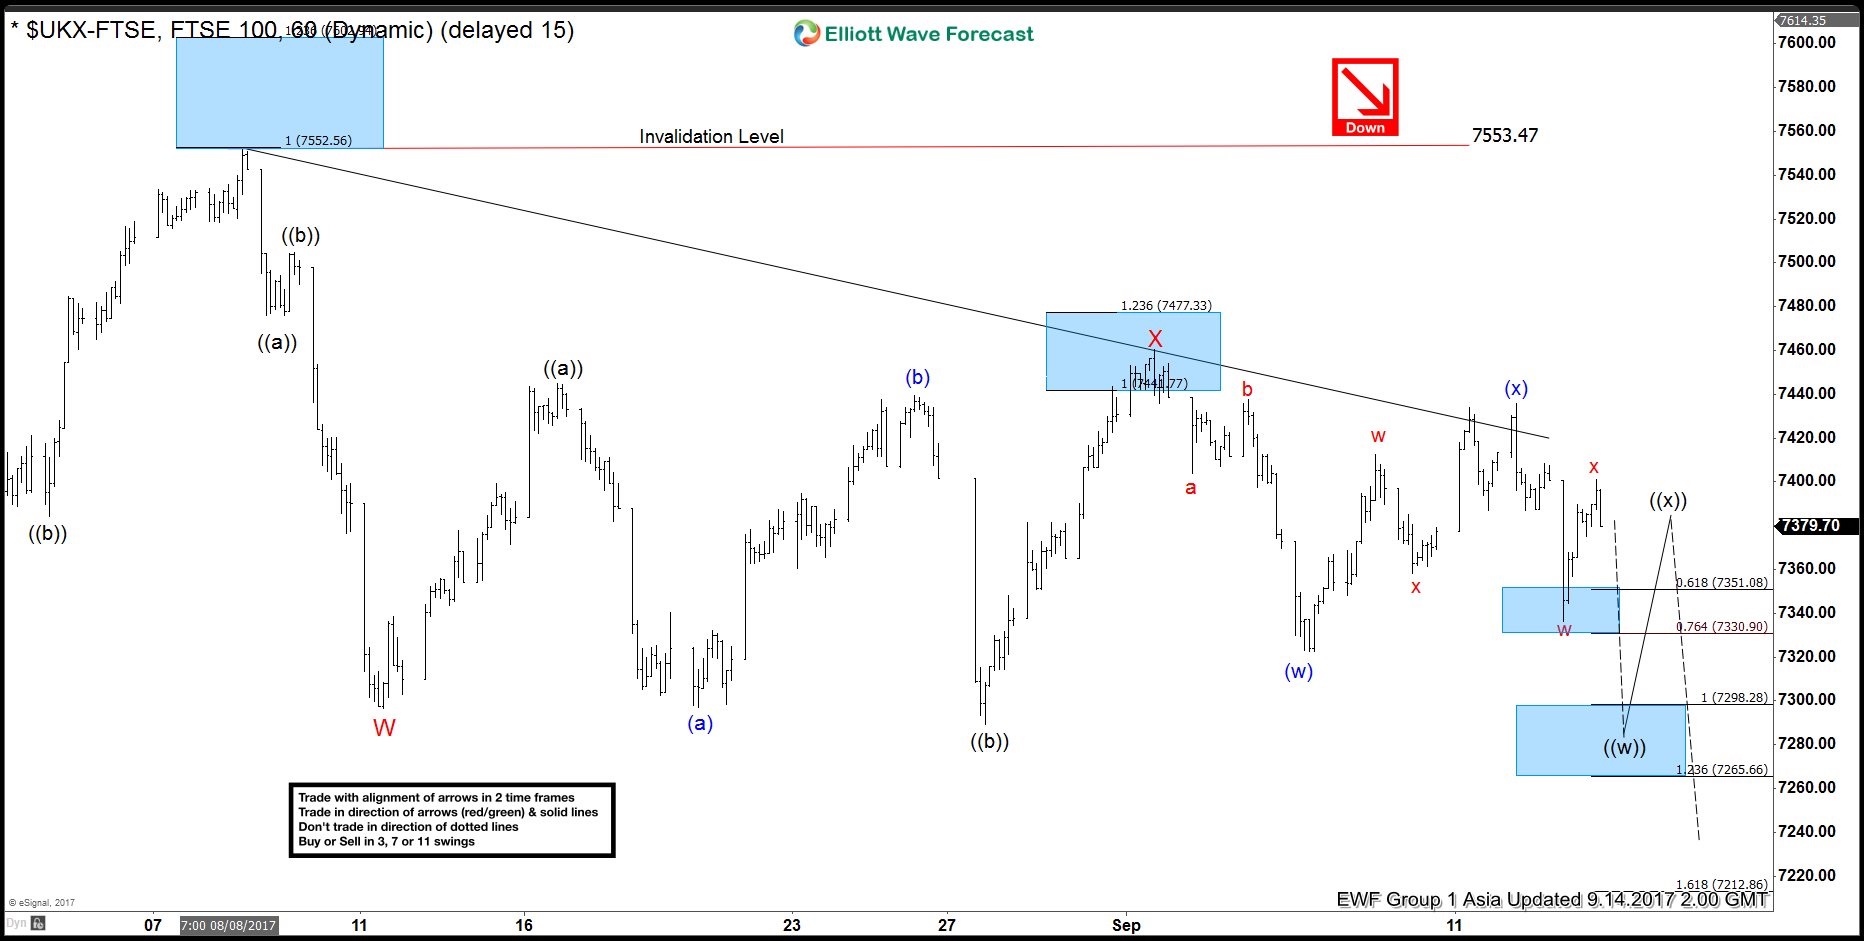
The index found seller’s as expected in between (7442-7477) 100%-123.6% Fibonacci extension area of ((a))-((b)) and resume lower in a sideways price action. And now reached the extreme from June 02 peak already at (7257-7187 ) 100%-123.6% Fibonacci extension area of (W)-(X) already. And soon should be ending the cycle from there or from 7552 peaks at least.
7 swings structure is one of the most common patterns in the theory of the New Elliott Wave & it is also mainly know as double three Elliott Wave pattern. Market finds that very often nowadays in many instruments in almost all time frames. It is a very reliable structure by which we can make a good analysis. And what is more important it gives us good entries with clearly defined levels invalidation and profit taking areas.
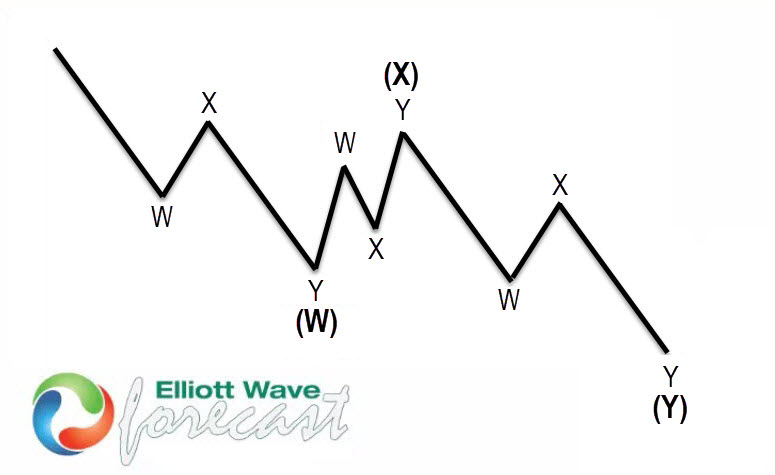
The image above shows what Elliott wave pattern Double Three looks like. Has (W), (X), labeling (Y) and 3,3,3 internal structures, which means that all these 3 legs are corrective sequences. Each (W), (X) and (Y) are made of three waves, which are having the structure W, X, Y in lesser degree as well. Elliott Wave principle is a form of technical analysis that traders use to analyze the cycles of financial markets. And market trends forecast by identifying extremes in investor psychology, high and low prices, and other collective factors. Important to Note that 3 waves could also be labeled ABC (5-3-5) structure as well. How are labeled 3 waves it depends on the internal price structure subdivisions waves i.e. whether the price action is corrective or motive.
