
With Gold Stocks So Bearish Are Their Internal Signs Indicating You Shouldn’t Be?
This week we are going to look at gold from a different perspective— the intrinsic value perspective. I will then introduce a unique unknown fund to invest in the precious metals and resource development sector. It is an incredible opportunity which invests your money right alongside the premier resource investor of this generation. I will then move on to what I will now label as my Post Bubble Contraction (PBC) watch section and examine the leading indicators to follow to keep abreast of the PBC process. We will finish up with updates on Plunger’s trades and other highlights.
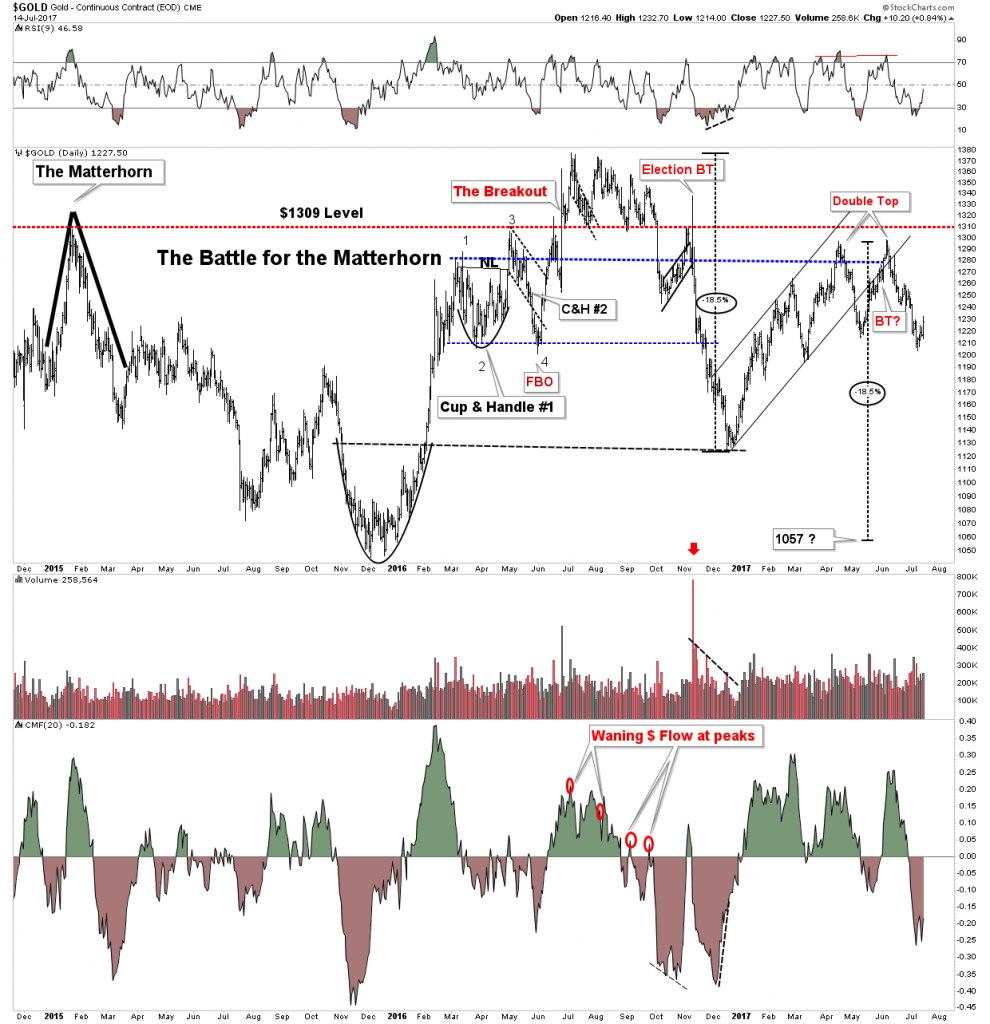
Last weekend’s report included several long-term charts of gold by Rambus. These charts point towards an outcome unexpected and unwelcomed by gold investors as the charts infer lower prices ahead. Since the number one rule of investing is ”don’t lose money” a prudent course would be to move to the sidelines in this sector except for special situations. I agree with this strategy, however, later on, I will explain why I am starting to allocate a conservative amount of funds into some of the gold shares in addition to the few promising discovery and development plays that I own.
Recently at the gold tent, I noticed a profoundly discouraged post. It was indicative of how beat up many gold investors are. The quote ended with this sentence:
“And come on now, folks. How much of a hit do we have to take before realizing the light at the end of the tunnel is not just a train, it has already run over us.
Hope is not a strategy. It is the pit of death.”
Of course, we all know these type of posts come near the end of a bear market so I would like to look at gold with an eye on the future. I see gold the same way I see oil…bearish in the short to intermediate term, but in the long term, these two sectors are going to make us a lot of money… That is If you can keep your eye on the prize.
Rambus’ price objectives are both valid and shocking, however, it is my view that these price objectives are derived from a paper, not physical trading system. Those measured move objectives may be reached, but I don’t personally believe you will be able to buy the physical anywhere near those numbers. Back in 2008 when silver was sporting a $9 price tag I couldn’t get anyone to sell me any silver for anything less than $14 and it didn’t stay there for long. Also keep in mind the old market adage: The cure for low prices is low prices! So it may get there, but it would only be the catalyst for higher prices later on. This will be true in both gold and oil.
Straight Talk About Inflation
“By a continuing process of inflation, government can confiscate, secretly and unobserved, an important part of the wealth of their citizens.” John Maynard Keynes
Let’s get right down to it…The dirty little secret…inflation funds the state. The Fed creates the money and the government gets first use of it so they don’t have to suffer the currency dilution effect, whereas the citizens do. So just like in Roman times, inflation transfers wealth from the producer of real goods to the first user of the new money. That’s what is going on in the world today. Keep in mind inflation is NOT rising prices, it is the increase of money and credit. Rising prices are the symptom of inflation.
Now you may not think price inflation is a serious threat since prices of daily goods seem to be under control or rising slowly. But this is a narrow view of the entire picture, call it a pie sliced view of the monetary structure. Just because consumer prices are not rising particularly fast does not mean that massive inflation is not occurring. Recall again, inflation is the increase of money and credit NOT rising prices. Rising prices is simply a symptom of the increase of the money & credit supply. So with central bank printing presses running red hot why don’t we have rampant rising prices? It is because in a post bubble contraction the increase of credit stays on the Fed’s & private banks balance sheets unable to get lent off… but its still there!
In Weimar Germany from 1920-23, the printing presses ran red hot producing currency and injecting it directly into the economy resulting in virtually immediate hyper-inflation. Keep in mind there was no developed bond market in the Weimar…no bond vigilantes. That’s not what is going on in today’s developed economies. Central banks are creating credit, not currency, so the money supply is being stored up, it is still there. With decreasing money velocity and a decreasing year over year lending rate, the credit stays on the banks balance sheets. Ultimately, however, it will have a delayed reaction in its effect on prices of goods and service.
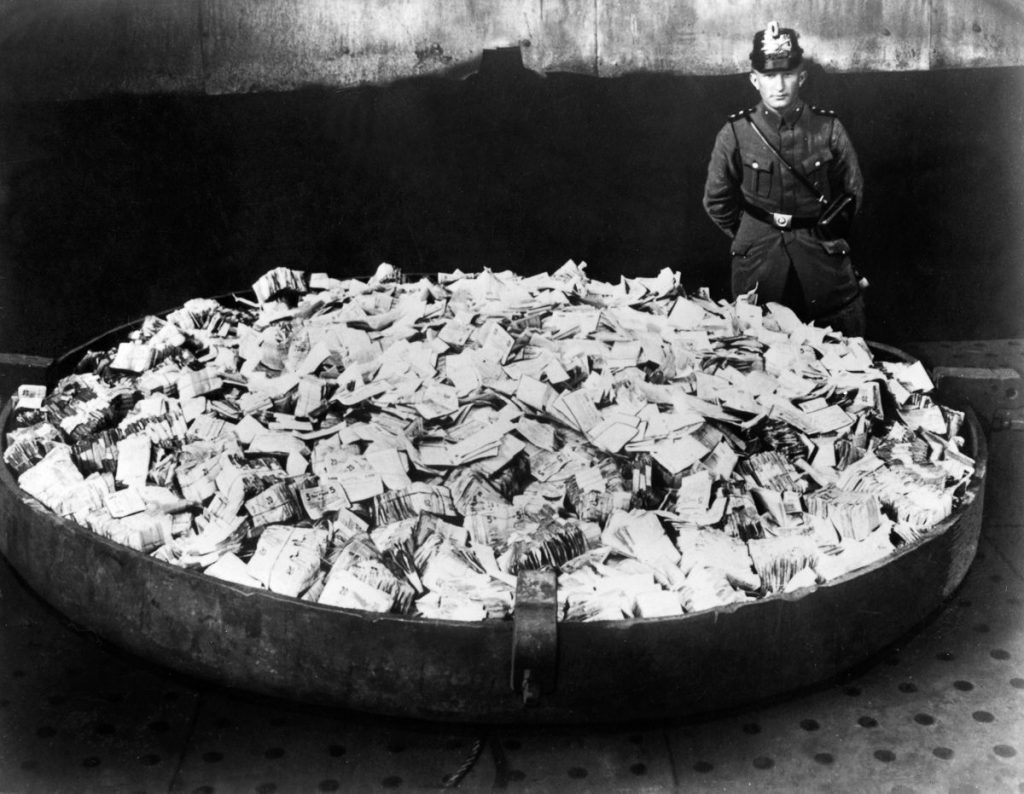
Above: Watching over worthless currency in Deutschland
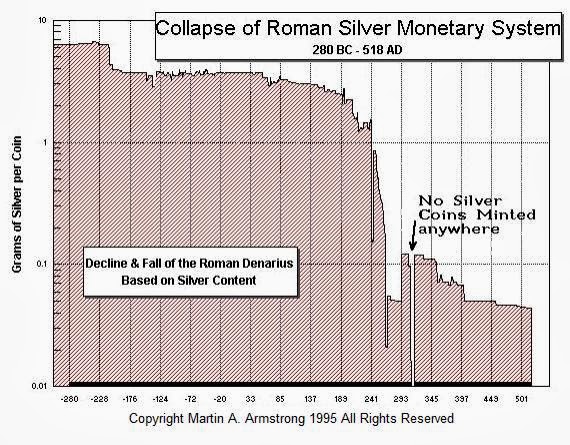
In Roman times, the government funded itself by sending slaves and treasure into Rome. Later on they increased their funding by higher taxes and the debasement of their currency. It started with the emperor calling in coins and clipping the edges and by the third century, the silver content had gone from 98% to 2%. Incidentally, our Fed has debased the value of the US Dollar at about twice the rate as the Romans did since the Fed was created in 1913.
Again Keynes, before he himself became a bondservant of the state:
“There is no subtler, no surer means of overturning the existing basis of society than to debauch the currency. The process engages all the hidden forces of economic law on the side of destruction, and does it in a manner which not one man in a million can diagnose.”
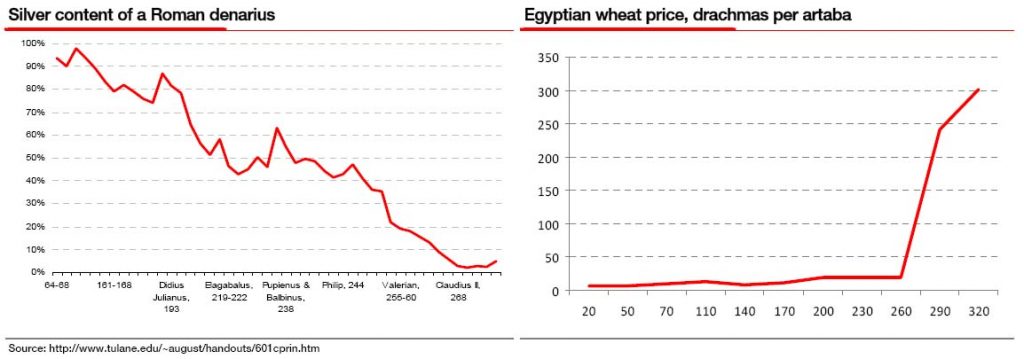
In Rome there was roughly a 20-30 year delay before the effects of coin debasement worked its way through into actual price rises. We also saw this delay effect occur in our modern economy as the US printed massive credit from 1945-1970 yet it was not reflected in the price structure until the mid-1970’s with the repricing of tangible goods such as grains, oil and gold. This same dynamic is incubating in the economies of the world today. The central banks are conducting massive QE but its effects will not manifest until the post bubble contraction runs its course. This process will have multiple knock on effects that we cannot possibly foresee, but eventually the world will likely reach what is known as the “bang point”. That is when the government can no longer continue its borrowing and insolvency becomes evident. At the bang point an inflection point arrives and the currency inflates along with an increase in money velocity. At that time the surviving credit in the system becomes reflected in the general price level. Recall that credit merely reflects claims on future production and prices will then account for the total outstanding credit in the system. Stated differently, prices will break out into a massive inflation.
Below we see when Rome hit its “Bang Point” as reflected in the price of wheat:
This general rise in prices will increase the desirability of tangible assets and depress the appeal of financial assets due to the store of value which tangibles embody. Again, the 1970’s experience occurred after the breakdown of the Bretton Woods monetary regime in 1971 which had followed the failure of the London Gold Pool price suppression scheme. Prices then began to immediately price in the great inflation that had already occurred. That’s what the 1970’s was all about. Just like in Roman times this process was subject to a delay which took over a generation before prices recognized the inflation.
1930’s Redux- First the Deflation?
The 1970’s was all about pricing in the great rise of money and credit of the prior 30 years. This is quite different from what occurred in the 1930’s which also experienced a rip roaring bull market in the gold shares. In the 30’s however, the gold stock bull market was the result of the post bubble contraction during the depression. Gold stocks rose as a result of falling input prices leading to lower production costs. As input costs declined the gold price rose because gold offered the ultimate form of liquidity in a credit constricted world. These similar conditions should be the foundation to the next bull market in the gold shares as well.
Gold as stored Energy
That’s what gold actually is…as well as other tangible goods are. Produced goods are a form of stored energy. Let’s think of the world divided into two categories: items produced and items yet to be produced. Financial assets are paper claims on items yet to be produced. These claims are subject to a myriad of ways to alter and distort their supposed value. Senior management may dilute these claims by awarding options to themselves or secondary stock offerings can increase the float of stock. The reality of financial assets is there are thousands of ways to dilute claims on the future production of assets that are beyond your control.
Physical gold, however, has intrinsic value, it’s not just a pet rock. The energy that went into producing it, the physical energy and intellectual capita, becomes intrinsic in the specimen itself. The difference of it being in your hand vs being a financial claim on future production is it’s NOT subject to dilution or to markets assigning a lower claim value since it is the actual post production asset. Financial instruments do not have this feature.
In fact, physical gold is quite the opposite of a financial asset, since it has already been produced and its value reflects the expenditure of energy to produce the next marginal asset. If there is an increase of monetary units to produce the next product that increase is reflected in the value of the existing asset already produced. Let’s call this store of value plus! This is the definition of intrinsic value. So the energy expended to produce remains conserved in the coin reflected by its price. In a world ruled by the reality of an increase of energy required to produce the same output, this becomes ultimately bullish.
This distinction of the value of physical stored energy vs claims on future energy expenditure should become acutely understood by markets as the economy approaches the Bang Point.
Got Gold?

It is with this long term view of the intrinsic value of gold that I continue my buying program. As I mentioned the price may drop well below $1,000 USD, however, I have little confidence I will be able to buy much below that price. So I really don’t mind paying the prices of today. In fact, down the road I think you will be able to bounce your grand kids on your knee and instead of telling them what you did in the great war, you will say… Yes, son, I was buying gold with both hands back when it was around $1,000, wasn’t I a genius.
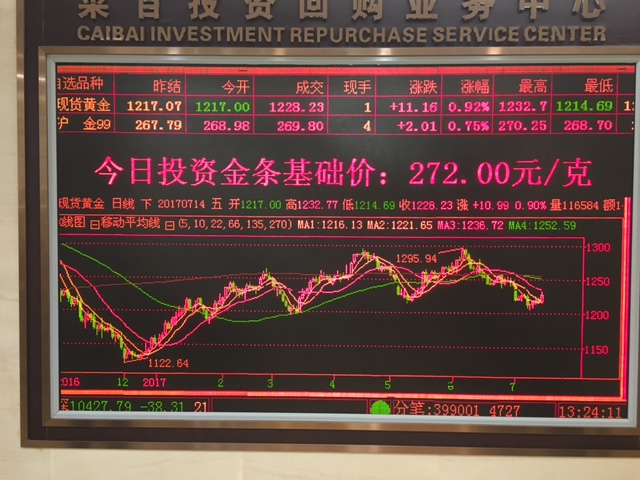
The average Chinese citizen is absolutely gaga about gold. Recently I dropped by the largest jewelry store in China and they take this stuff so seriously, they have a real time electronic gold chart and it’s a real exercise pushing people away from counters just to see the displays.
Pop Mining Quiz:
Who is the #1 gold producer in the world?
Ans: PRC.
That’s right, China. Oh, and name me just one major mine in China.
Grasburg, Lihir, Muruntau, Olympiada, Oyu Tolgoi, Pueblo Viejo, Mponeng, Cadia East, Yanacocha? Nope, sorry all outside of China… there aren’t any.
I have flown all over China and seen numerous mountain tops scraped off from mining operations. They seem endless. Only small mom and pop ecological disasters exist in China, yet they are the largest producers of gold. Recently China is undergoing an awakening in environmental sustainability. It will take time, but ultimately this type of marauding production will cease. As of now they produce with the same level of urgency we produced the fire retardant, antimony, during WWII in the state of Idaho. We destroyed salmon runs and killed off numerous fish populations in our recklessness. This is where China is now, and it will soon stop as they attempt to join the world as an equal member.
Bottom line: Environmental policy change and production restrictions will increase the energy expended to produce gold, but once you hold it, that increase energy expenditure will be stored in your possession denominated by price.
A Special Situation- SRHI
The Private equity model has proven to be the most profitable means of market investing. Professional management searches for diamonds in the rough then uses contacts in the world of banking and the markets to acquire the properties. They use pools of capital coming from high net-worth individuals and family offices. Pension funds and sovereign wealth funds also are typical participants.
I bet you have never been invited to invest in private equity, it’s a great deal reserved for the well healed. But guess what, there is a unique little known freshly minted vehicle that allows you to do just that in the resource space. Better yet, it is run by a champion investor who is regarded as one of the most well connected, savvy resource investors of our time. He has invested his own money into the fund and your money will go to work on the same terms as his. The reason private equity is so advantageous in the resource space is because it’s all about deal flow. Investors in this vehicle have an unassailable advantage sitting in the catbird seat watching everything that comes down the pike. The extensive network of industry contacts gives them first dibs on deals you cannot possibly ever hear about. On top of that this vehicle has the staff and resources to do its own due diligence on any potential projects. Furthermore, the positions it takes will be controlling interests in the majority of its holdings.
Since large banks are no longer in the financing space for resource start-ups, due to the 90% bear market, this opens up great opportunities for those who can deliver the funds. Furthermore, the few high-quality assets not listed in ETF’s are undervalued as the ETFs have distorted the market resulting in inefficiencies in valuation. These inefficiencies are to your advantage.
The vehicle I speak of is Sprott Resource Holdings (SRHI)(SRHIF) and its run by Rick Rule and his closest staff. In January 2016 at the Cambridge Resource conference in Vancouver, at the absolute low of the bear market, I asked Rick what was the plan with Sprott Resource Inc? It was a bombed out investment vehicle which had suffered from the destructive effects of a bear market. This fund was a holdover from the days of the Sprott side of the business, not the Global Resources side which was Ricks pre-merger company. Rick just shook his head and told me there was going to be a shake up. Well, it took a bit over a year, but the vehicle has been rebooted under new management and new principle money. It trades on Toronto and anyone can now buy it. So technically it’s not private equity since it trades on a public exchange, but it is essentially the same thing.
Last reported they had 90 million invested and 78 million in cash. They currently have invested 20m in Energy, 30m in Agriculture and 39m in Mining. I personally have taken a position and it is a buy and hold asset for me.
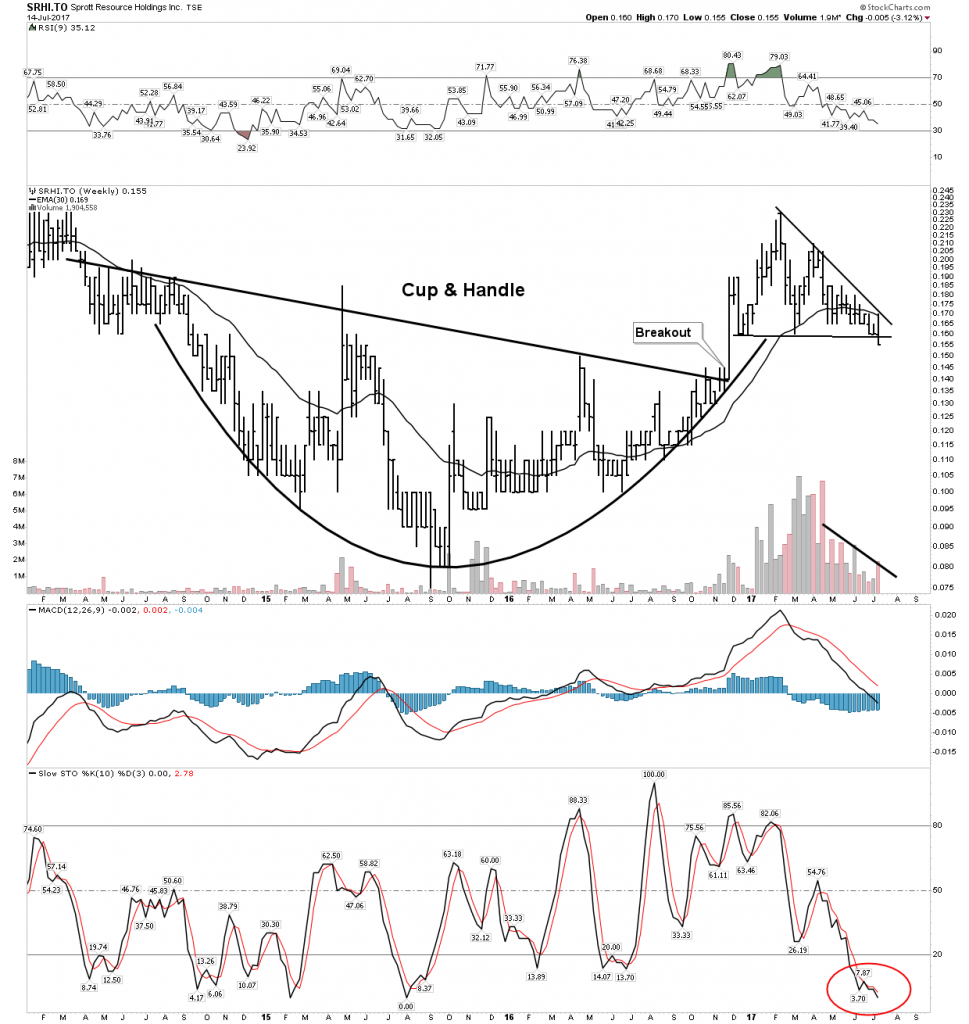
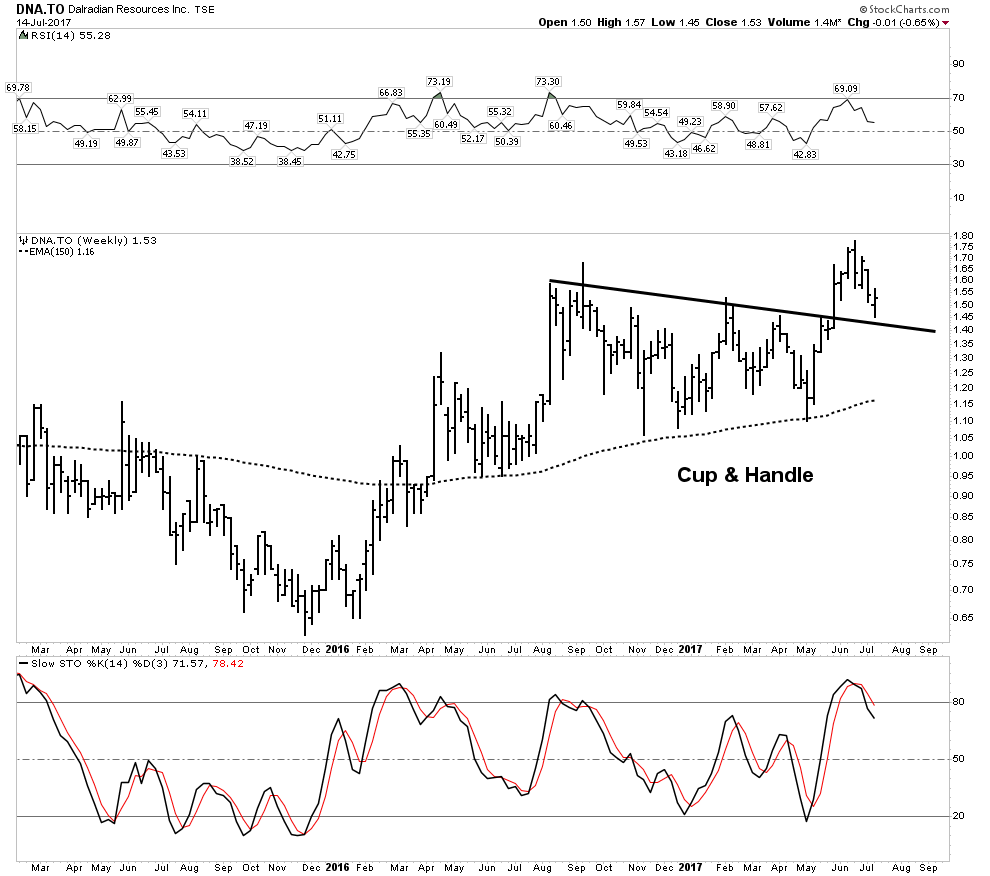
My analysis of the chart action is this is building out a massive authoritative Cup & Handle. It has broken out of the cup and is now consolidating the handle. This consolidation is occurring on decreasing volume. this is bullish. Stochastics are now stretched to a downside extreme I see this as a very bullish set-up for the longer term.
Despite my prevailing view that Energy and Gold investments are likely to fall to lower levels before the ultimate bottom, I have taken a position in this stock. I am taking the longer view here with a partial position. I am not cocksure enough to claim that I can nail every bottom out there and this is such a unique opportunity that I want some permanent capital in it.
Gold Mining Stocks- I am starting to hedge my bearishness
You read that correctly knights, I am starting to hedge, meaning I am beginning to nibble on some prospective producers even though the price action in the charts portray a bearish configuration. This is an important announcement because I perceive a possibility of a sea change going on beneath the surface. Please let me explain as I don’t want this misinterpreted as a bull call, it’s not. However I do see some signs which make me want to own some producing companies because we could wake up one day soon and discover the game has changed overnight and you will not have a chance to get in at anywhere near the prior days prices.
I am going to get a little geo-political here- I hope you can handle it.
After Trump got elected I had high hopes for him. As a staunch libertarian and non-imperialist, not a republican I was able to identify with some of the things he said during the campaign season, such as: “drain the swamp”, it wouldn’t be so bad to get along with Russia” etc. So now 7 months into office and after a few skirmishes, it’s pretty evident to me that the swamp is draining Donald and the Neo-Cons and intelligence agencies have won out over any peace initiatives the President may have harbored. I wish him the best, but I no longer have any illusions regarding the conduct of foreign policy. Its been a shut out Neo Cons 1-Trump 0. This is not the right venue to discus the details of all of this so let’s just say the world is becoming a more dangerous place. Trump stated China had 100 days to “fix” North Korea. Well here we are this weekend at 100 days. Things could now start heating up. Not only in terms of military threats, but in possible action against China such as a steel tariff.
I have enough of a background in military and air warfare to know about models of war escalation. For 40 years the US played a blind man’s bluff form of nuclear chicken during the cold war. Fortunately, this approach worked as the other side blinked numerous times. This model is based on the concept of rational actors. But here is the thing, the evidence indicates to me that we may NOT have rational actors on EITHER side. I am not referring to Putin, as he is a rational actor, but the US Neocon community. Frankly, these people are not patriots, they are dogmatists. Numerous geo-political triggers could cause an inflection point in the perception in owning gold overnight. I understand the charts are bearish, but things could literally change in the blink of an eye. Simply put, I don’t want to get caught at the station when the train has departed.
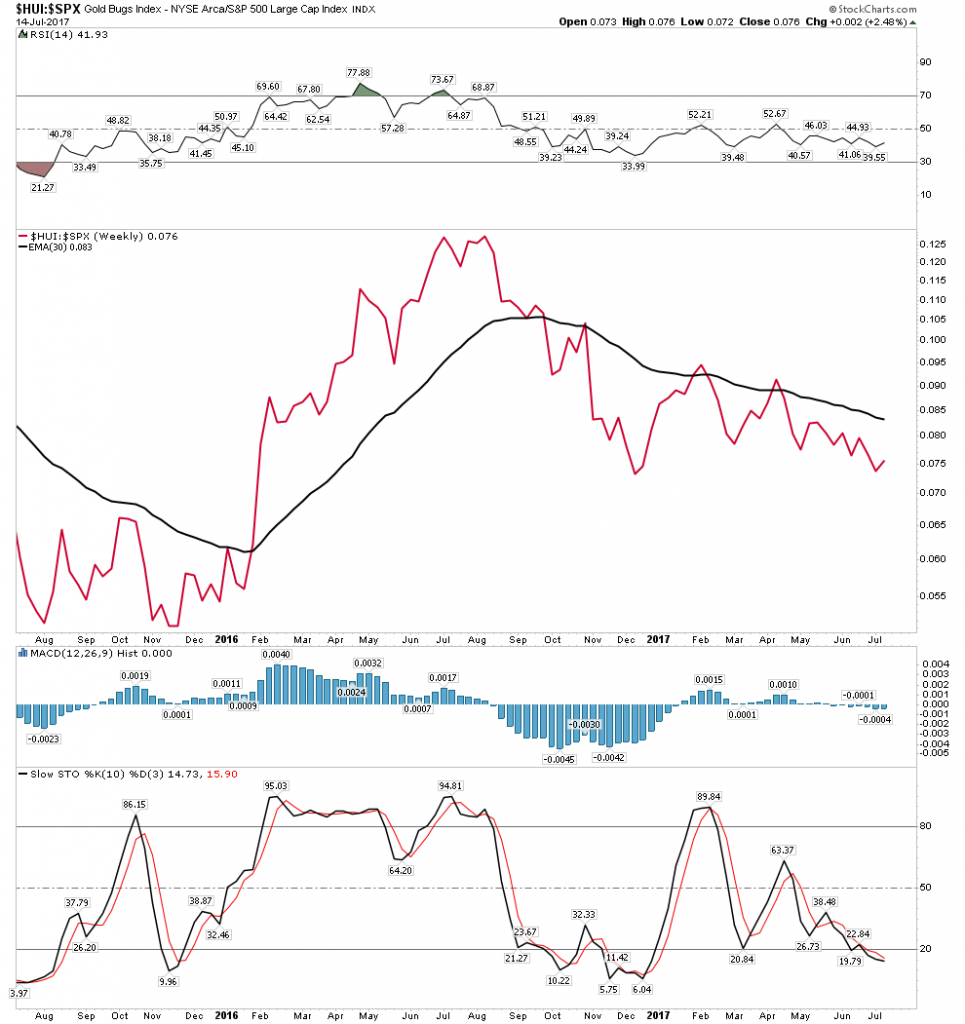
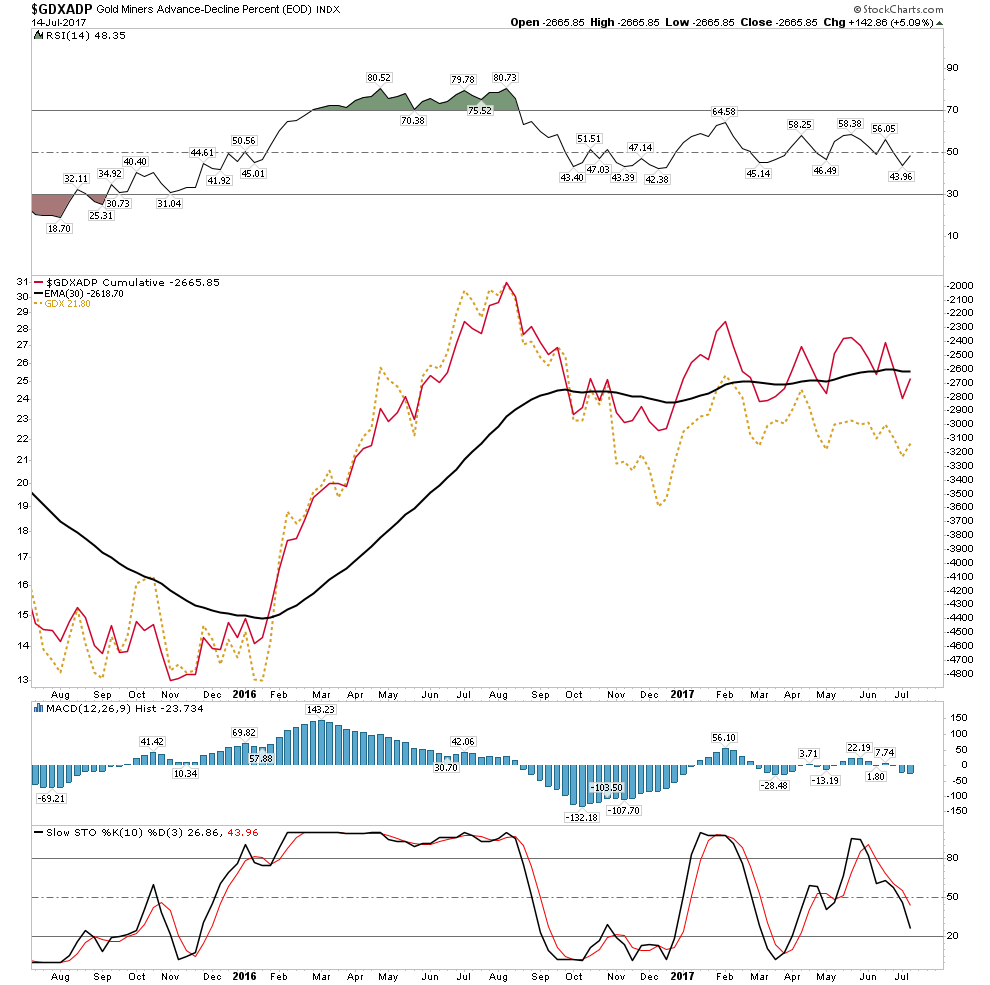
With this geo-political view in mind let me also give a different perspective on the gold chart not reflected in price, but internal action. Unfortunately, stock charts does not provide the ARMS index (TRIN) for the gold stocks. The TRIN is a breadth measure indicating sentiment. It is calculated by dividing the Advance-Decline ratio by the Advanced-Decline volume ratio. Look it up for further explanation as its a powerful tool. In the last three lows of the GDX since March the TRIN has spiked to extreme highs. This is a measurement of fear in this case. I understand that the prevailing narrative indicated by the bearish GDX chart is that of a continuing bear market, however, I think it's worth considering the other side of the coin. If the 7 month move up in 2016 was the first leg of a bull and we have been consolidating that move over the past year, then these TRIN levels indicate that consolidation may be near completion from a sentiment perspective.
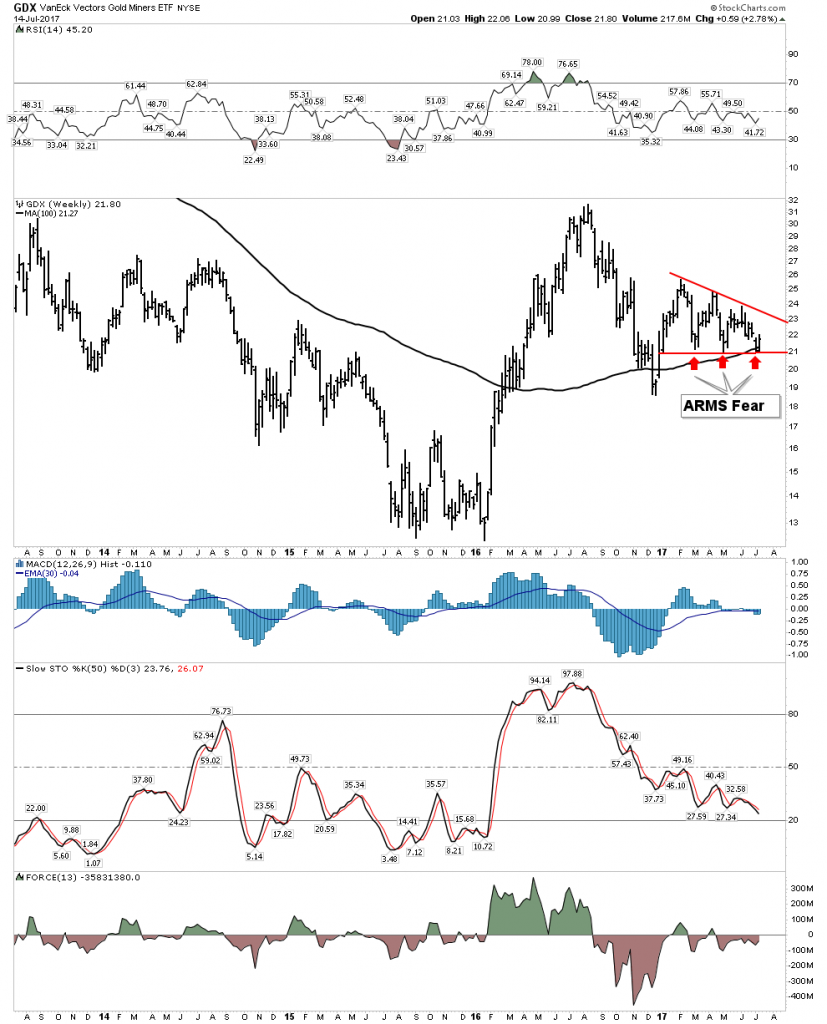
The chart above uses the 50 W EMA
The above perspective is the basis to consider the possibility that the gold mining stocks could be washed out enough from a sentiment perspective to now be positioned for an advance. This analysis is based on sentiment and the internal ARMS index, not price structure. If a geo-political event were to trigger a change in sentiment I see the possibility for a phase shift to occur in the perception of the metals which would immediately be reflected in price.
You have been warned!
Strictly from the price action there certainly is not anything here to get excited about. Below is a review of my bull market indicators:
Shift from Growth to Value assets
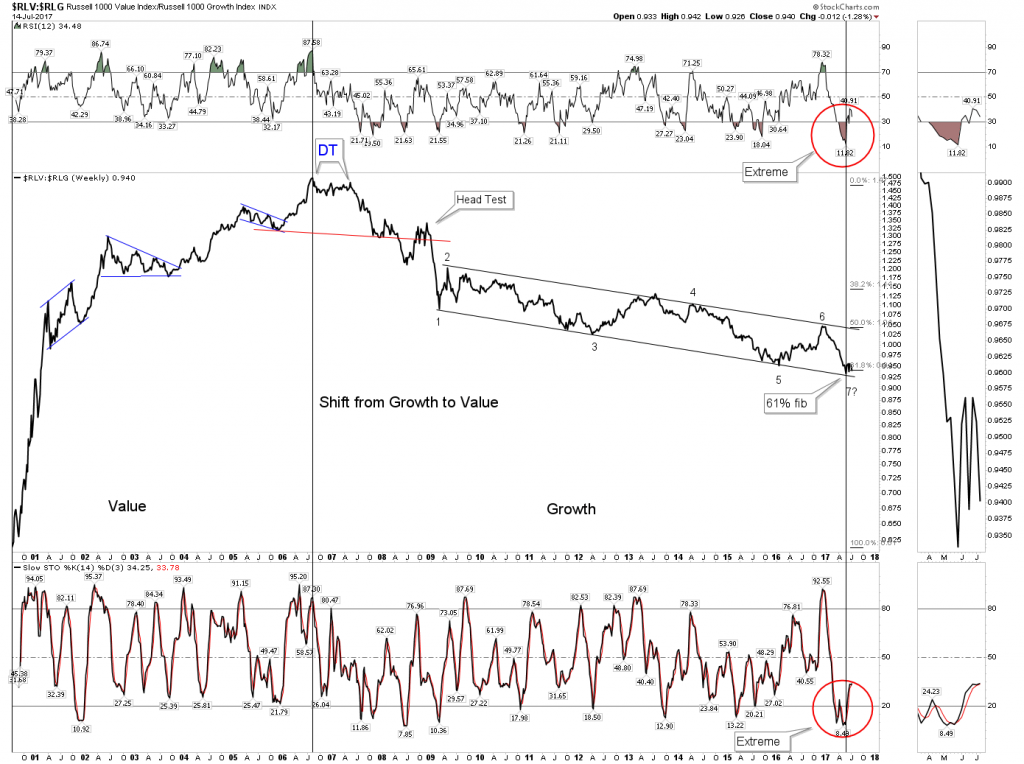
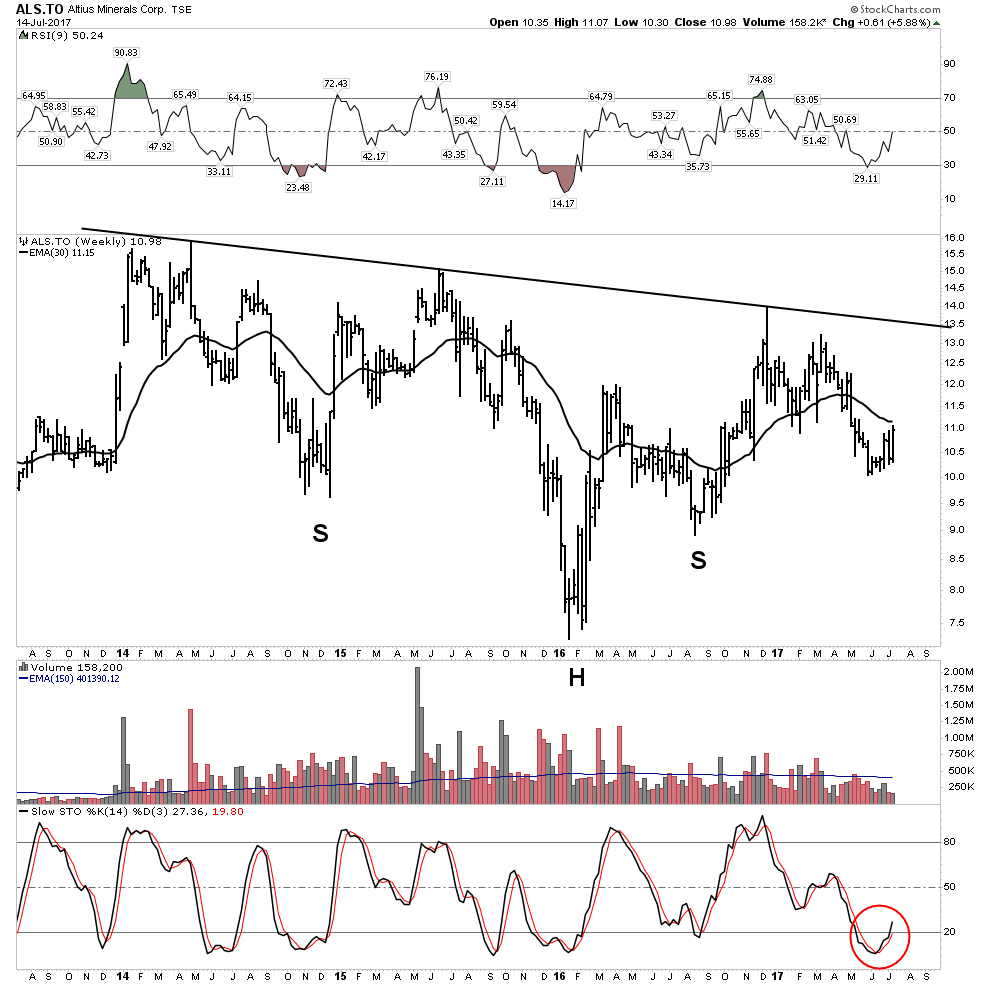
Here’s an update of the transition from growth to value in the market. IMO this embodies the shift from financial to tangible assets as well. In the first piece I mentioned the ultimate outcome of todays PBC workout should result in rampant inflation once the deleveraging process runs its course. In such an environment tangible assets will be the place to be. This is where my largest holding comes in… Altius Minerals.
Altius is in the business of building out a royalty portfolio that emulates the production profile of the great resources companies of the world. The BHP’s, Rio Tinto’s the Vale’s etc. It was created in the college dorm room of Brian Daltan a fisherman’s son from Newfoundland. Brian is the ultimate counter trend value investor. He saves his cash during the good times and deploys it in the bad times. Easily said, very seldom done. He has been able to dislodge world class Trophy properties and buy them when their owners were desperate.
For the past 7 years Altius has been the ultimate boring stock as it has gone absolutely nowhere. When one thinks of Altius one should repeat in ones mind the words of E. George Schaefer of Dow Theory fame:
“An investor who will study values and market conditions, and then exercise enough patience for six men will likely make money in stocks.”
Schaefer had an uncanny intuition for market timing and nailed the bottom of the market within 5 days of the start of one of the greatest bull markets in history on July 18 1949. So it is my conviction that Altius will be the type of vehicle that will best perform in the coming great inflation as it owns the royalty stream from some of the best resource assets in the world. Its costs will be fixed, yet its royalty stream will increase with the price of the asset. In a future report I will lay out the investing thesis of Altius Minerals in detail.
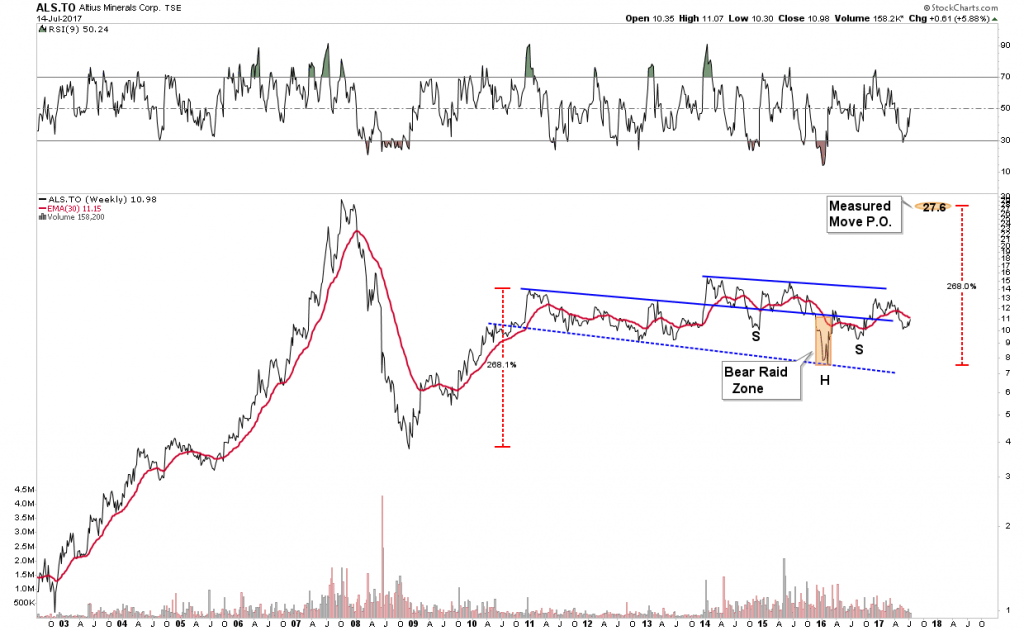
These two buy and hold portfolio positions, ALS & SRHI are examples of taking a strategic view of markets recognizing that markets are often ruled by noise and we are better served by riding multi year trends rather than trying to focus on the short term.
Plunger’s Post Bubble Contraction Bubble Watch (PBC)

This will be a permanent feature of my Bi-Weekly column as it is the key theme of today’s market. It is a view of the global macro environment. Why is this so important? Because it analyzes big picture thematics and this is how the big money is to be made. We cannot just be passive observers, we have to anticipate and get out in front of the big macro trends. We are in the end phase of a full credit cycle spanning 70 plus years. It is the 6th such cycle in the era of modern finance which began in the late 1600’s. That’s a pretty big picture view, however, it provides us context to observe market events and shows us how to put the wind at our back.
A Broad Unfolding Top
That’s what I believe we are in. It is what I have been chronicling over the past 3 months. Of course, I recognize the charts Rambus has been putting together do not concur with this thesis and I highly regard his work. So how to I square this diversity of opinion? The end of a credit cycle unfolds differently than a normal cyclical bull market. What is different is the economy turns down simultaneously with the stock market. A normal cyclical bull market ends 6 months to a year before a recession arrives. This is because the market is a discounting mechanism and it sees it coming. The end of a full credit cycle, however, ends differently. Both the market and the economy decline simultaneously. This is what occurred in 1873 and 1929. There was not any obvious warning in the actual price of the averages. This is why I believe Rambus’ charts appear so long-term bullish. I have initiated a limited number of short positions on this market, however mainly as a probing tactic. Call these the lead soldiers to my downside campaign. I also recognize the longer we stay up near these long term highs the more chance exists of a spark which could ignite a bout of short covering to even higher highs. This is what occurred in the summer of 1929 when it was obvious to many informed market operators that the end was nigh.
All Bull Markets End Badly- Ben Graham
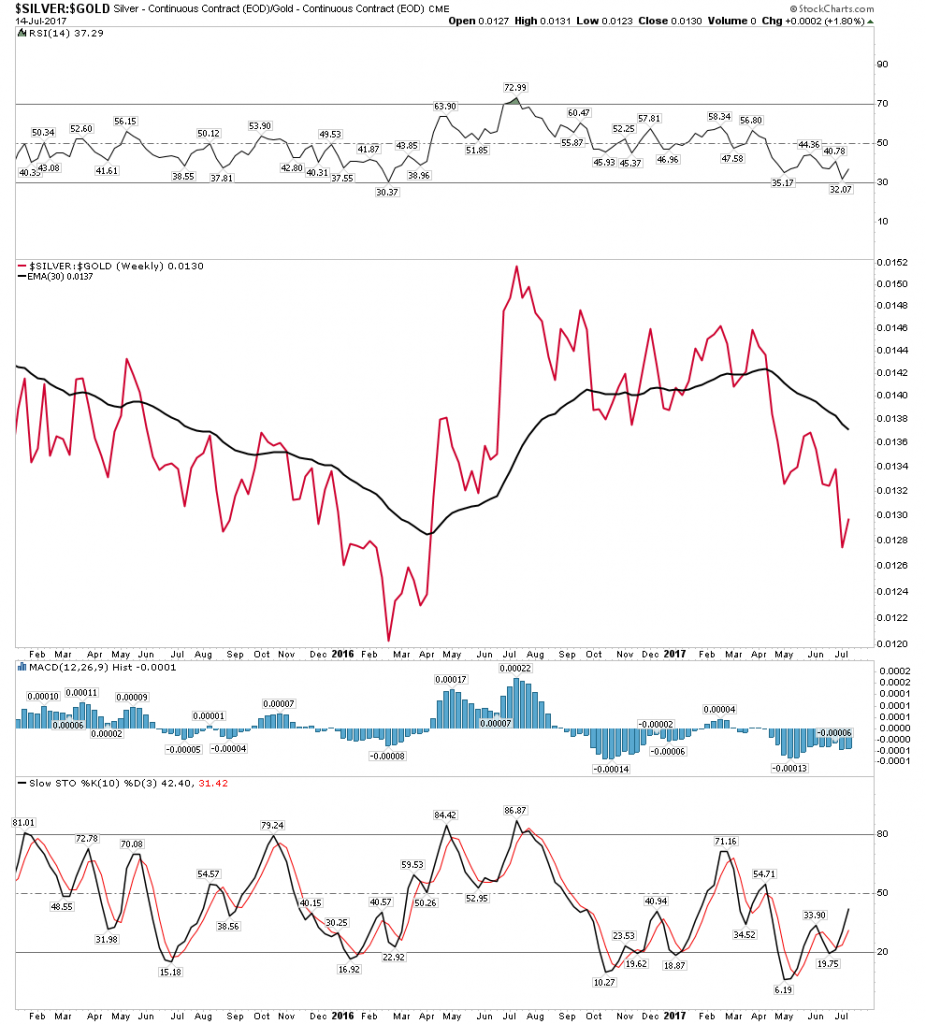
Gold Silver Ratio
I continue to perceive a lot of misunderstanding of the GSR as a market forecasting tool. Granted it is somewhat of an esoteric indicator, but that actually works to our advantage. Name me another site out there that is focused on this indicator and sees the utility in it? The GSR, of course, measures the value which the market assigns to the relationship between the price of gold vs the price of silver. In times of credit stress, the market much prefers gold over silver. This is because gold is money and silver is chiefly an industrial metal with monetary properties. When economic conditions become stressed the consumption of silver lags. However, as is shown by Exeter’s Pyramid gold attracts capital in crisis since it is the ultimate form of liquidity. Why is it the ultimate form of liquidity? Because of what we previously discussed-gold is stored value, not a claim on future value.
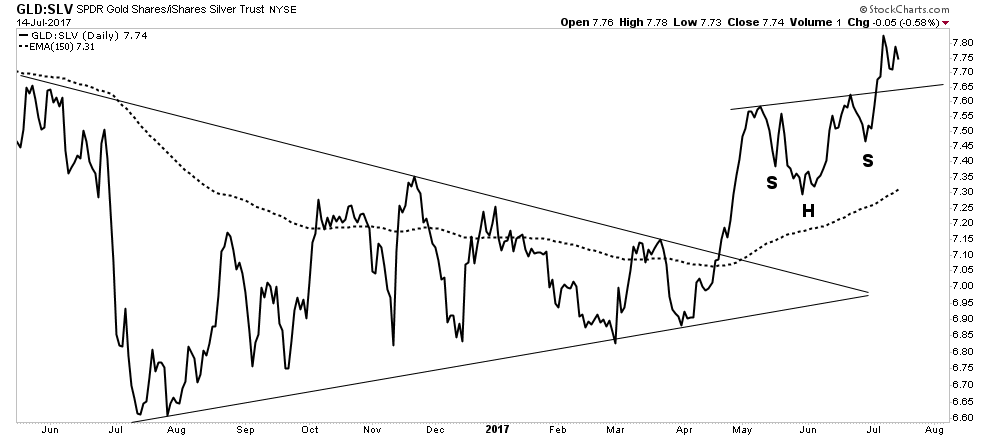
So how do we analyze this indicator? I think the chief obstacle with most investors is they want to see it as an absolute measure as opposed to a relative measure. Just because the current ratio is a smaller number than it was in the 1990-91 credit event does not mean it is forecasting less distress. It is the relative movement that is important. Different eras assign a different valuation to gold vs silver. We don’t need to measure one against the other to receive the utility of the GSR. Having said that however, I do anticipate that the next economic crisis may lead to a GSR that breaks all the previous records. That, of course, will be a reflection of the illiquidity of the crisis that exists. How high could it go? I am guessing we will hit GSR 150.
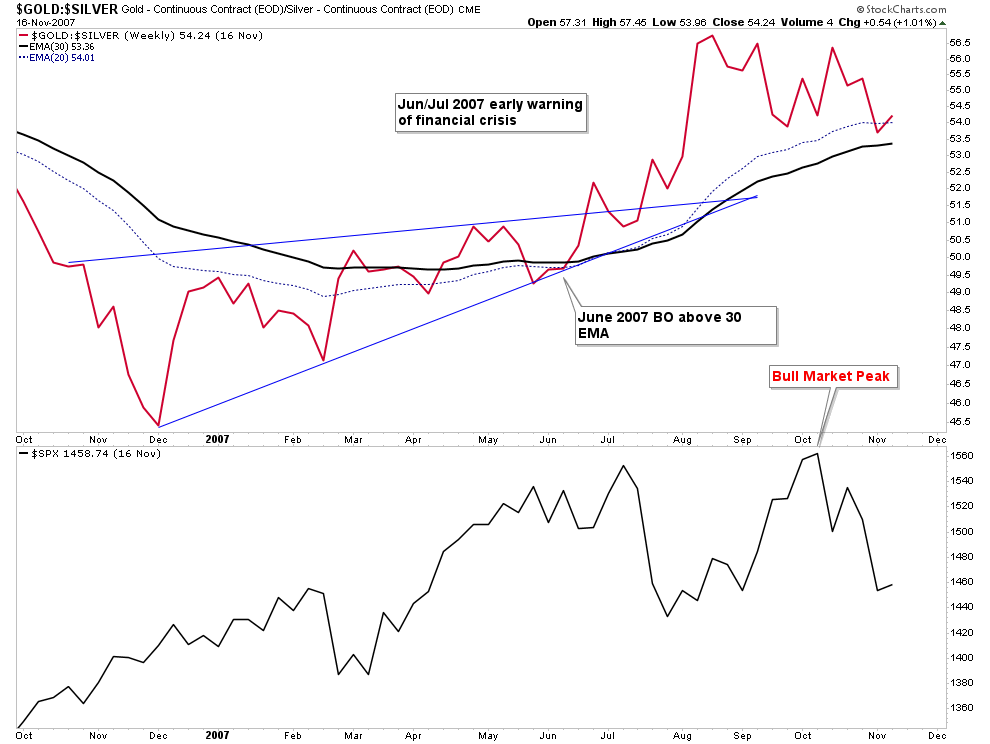
In the above chart we see how the GSR forecast the initial tightening of credit and the top of the market in 2007.
So the GSR acts as a metallic credit spread and it’s currently telling us that credit stress lies ahead in the future. Historically markets clear in the fall so this is likely looking into that time period anticipating a clearing event. This is why I started positioning myself earlier this year to deal with this circumstance. I have sold all real estate and sit on ample deployable cash if and when this occurs. I am exercising patience and I have learned to anticipate and wait.
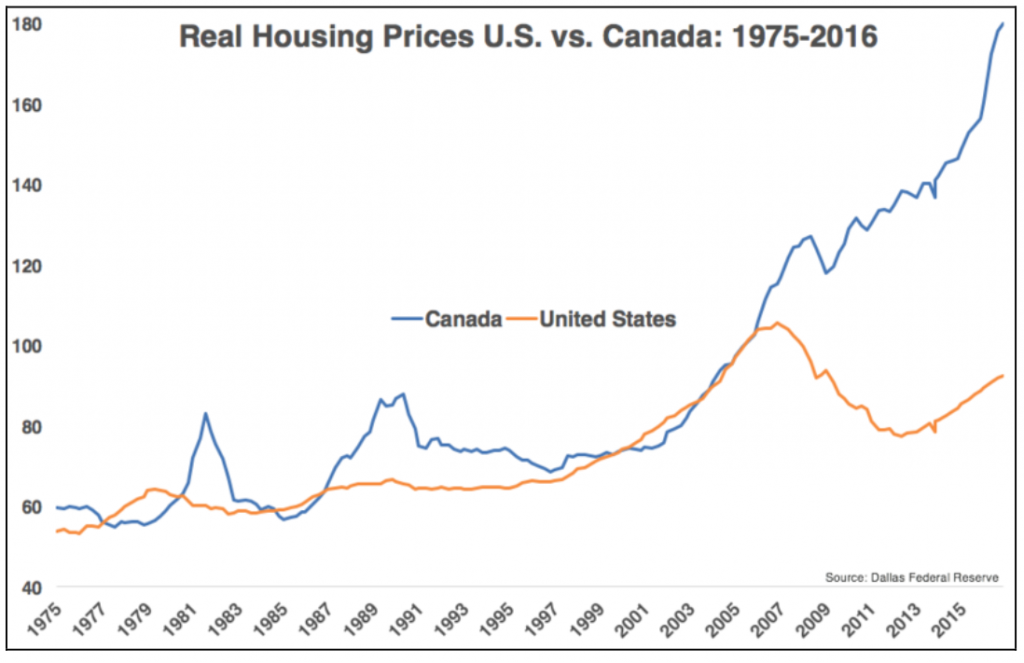
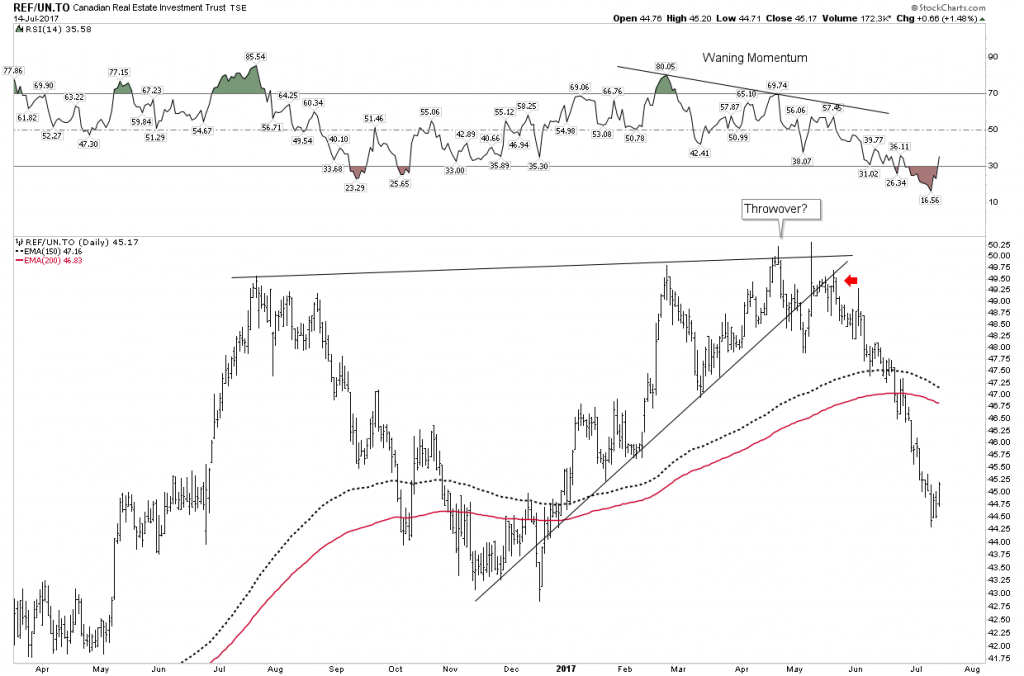
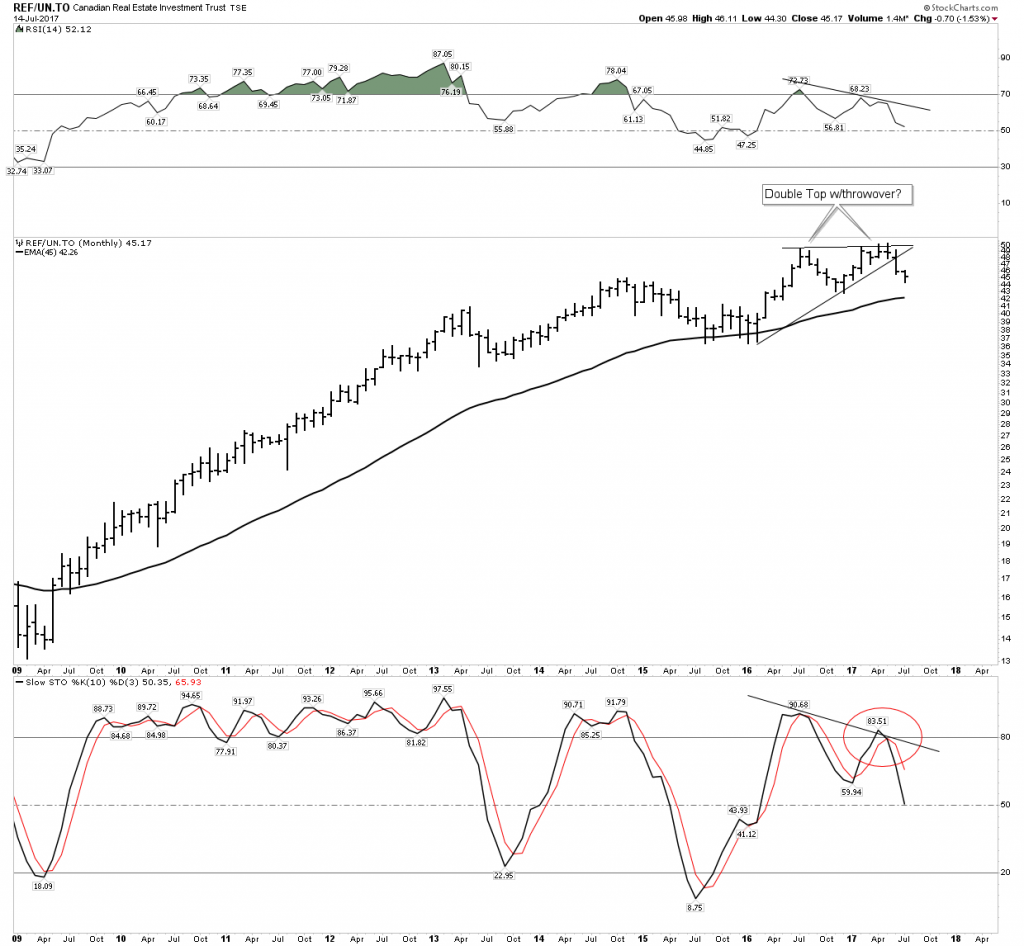
Canada Watch:
The everything bubble floats out there waiting to be popped. Where will the catalyst come from? Canada is one of the possibilities as its housing bubble appears to be in the early phases of bursting. We watch the Canadian banks and the Canadian Real Estate Investment trust for signs. We should have traded the bounce in Canadian banks, however, we can only do limited things.
This is what rates set at the zero bound will do for you when there is no crisis:
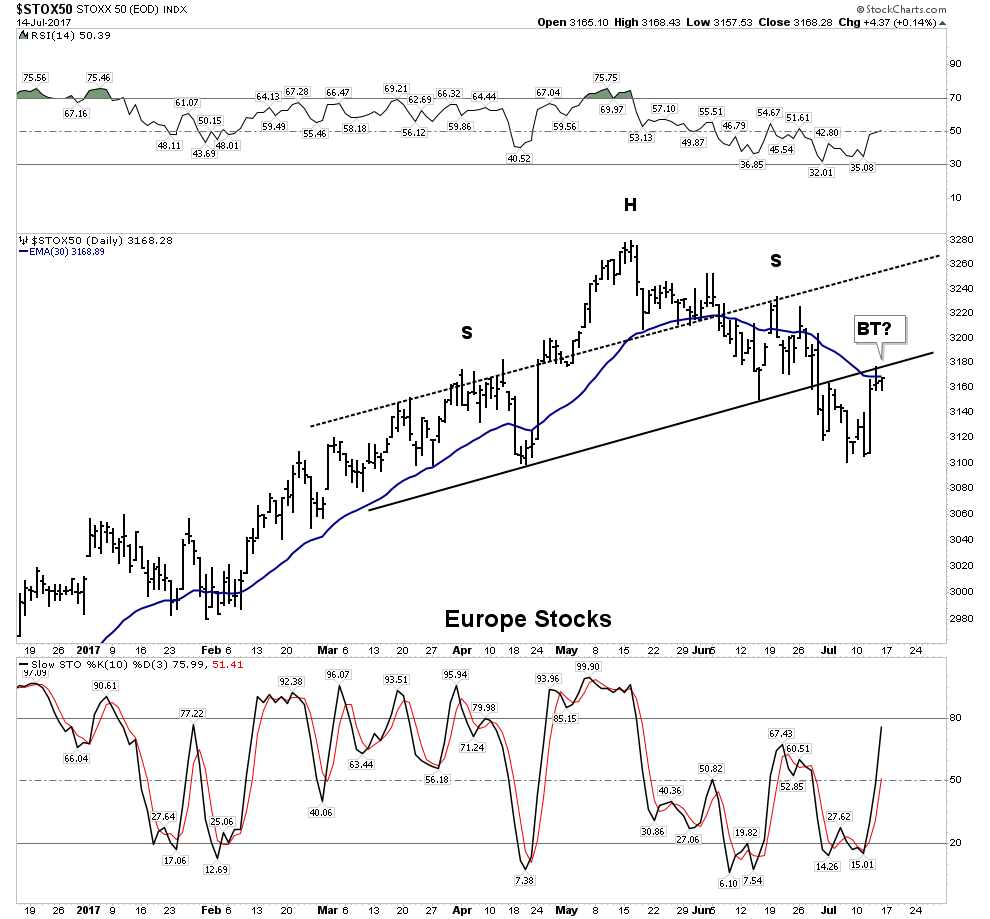
Europe Watch:
I have made the point that our PBC model calls for the historical precedent of the European markets to peak first. So far this thesis is on track.
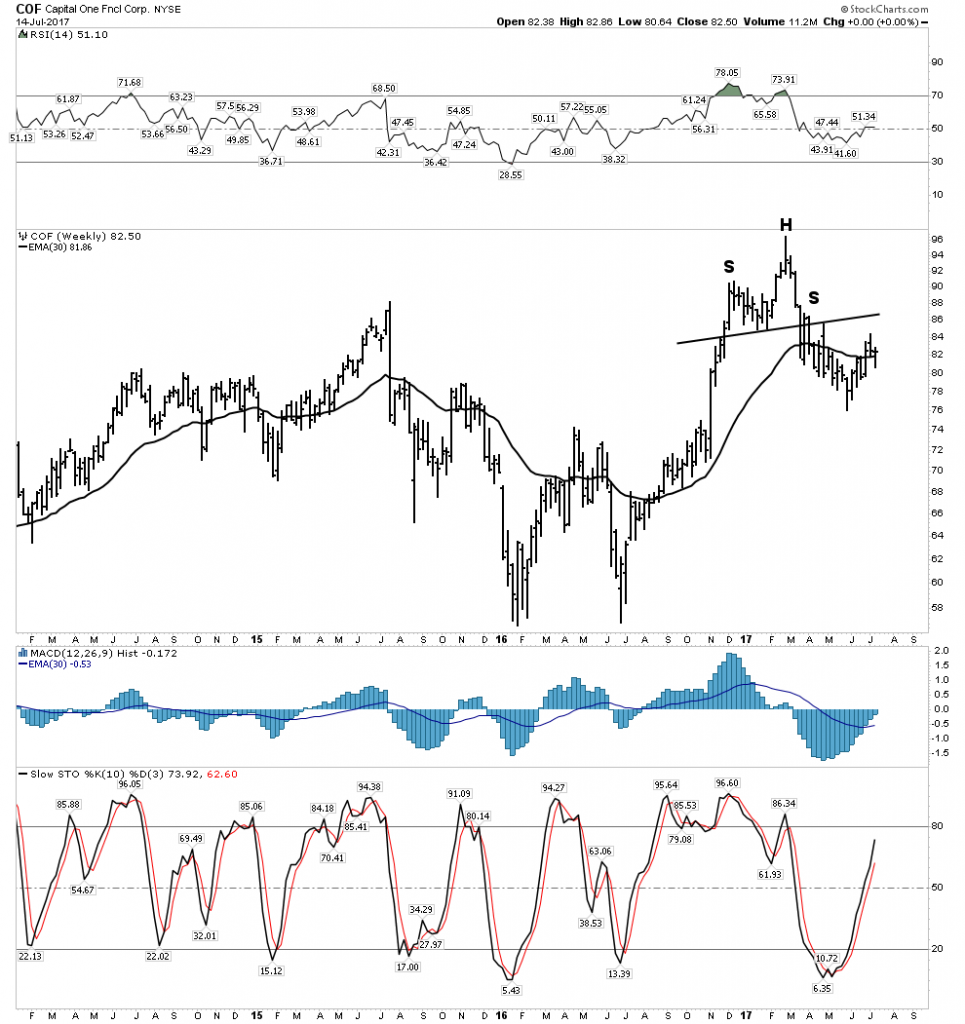
Auto Watch
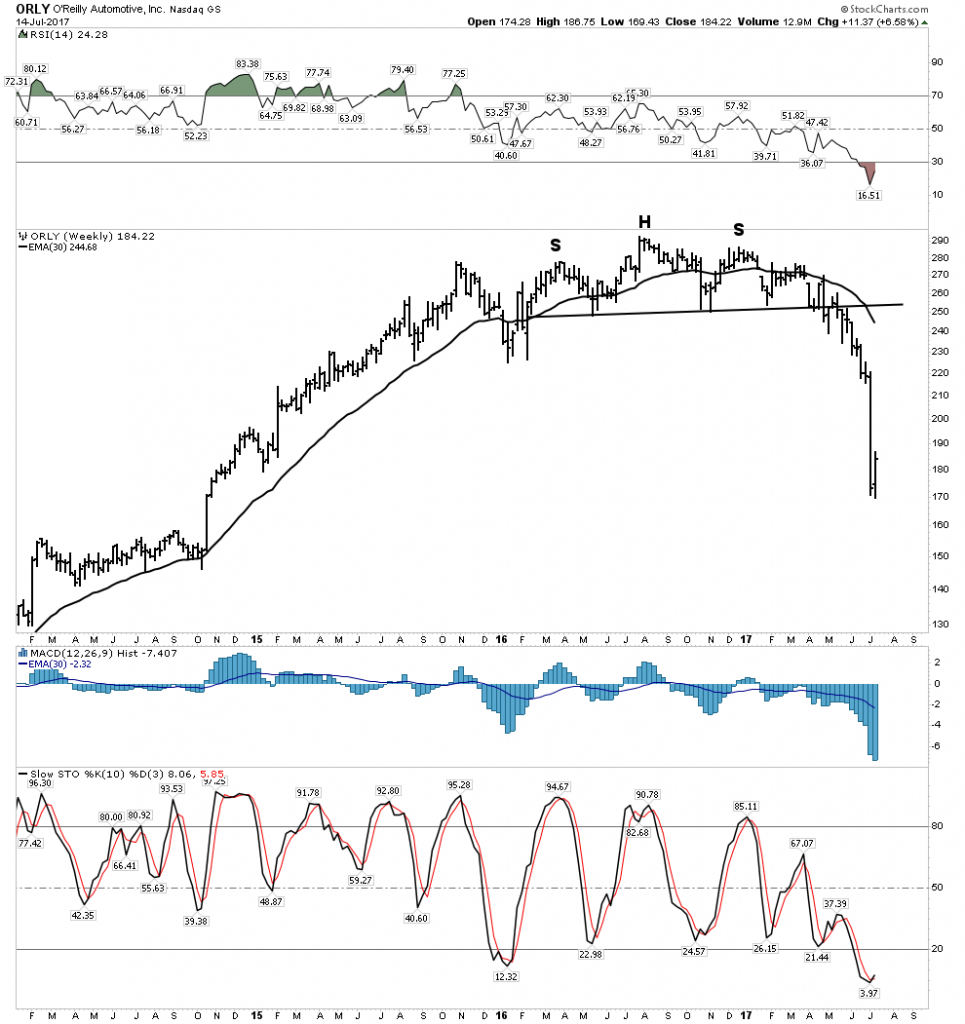
This sector continues to head for carmageddon. In the prior report, I mentioned O’Reily Auto Parts may be the next shoe to drop and follow AutoZone into the abyss. Well that’s exactly what we saw happen:
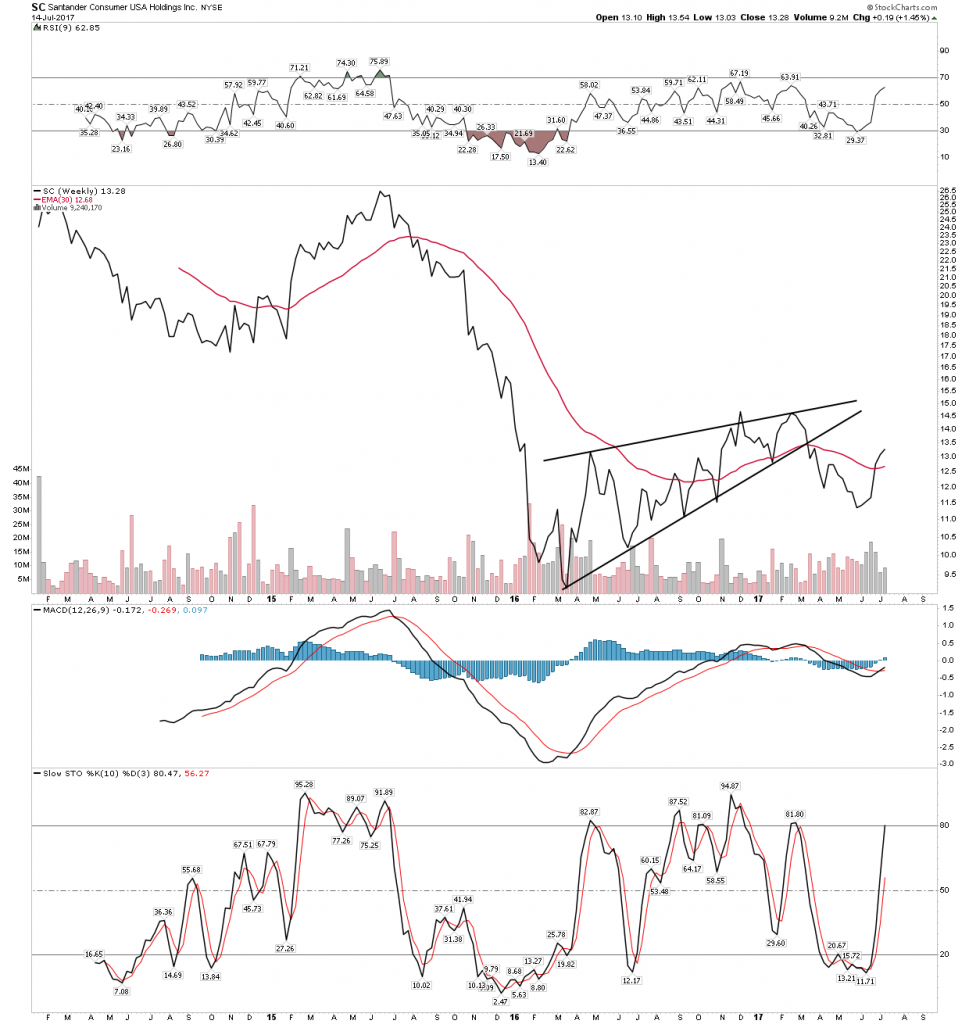
Subprime offender-SC
More Auto Finance Sub-Prime
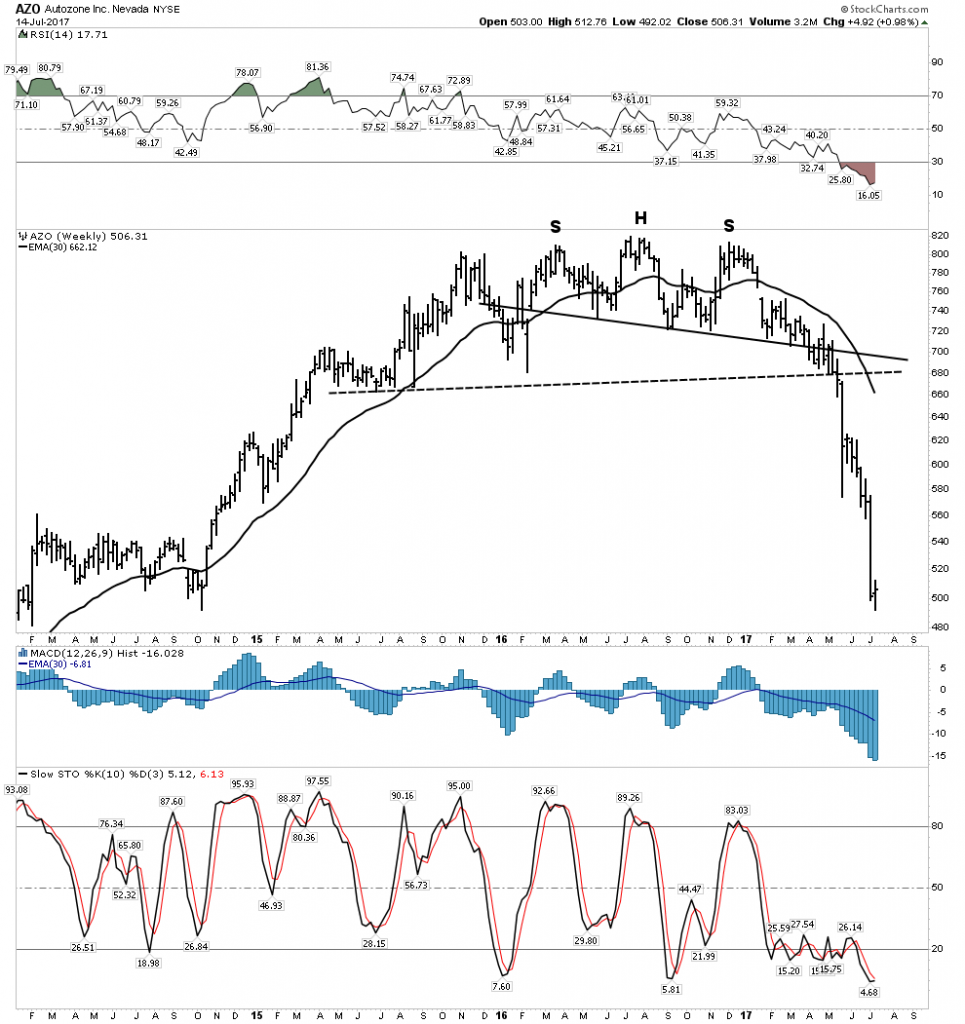
Above Auto Zone, and remember 2 weeks ago I mentioned O’Reily looked ready to follow!
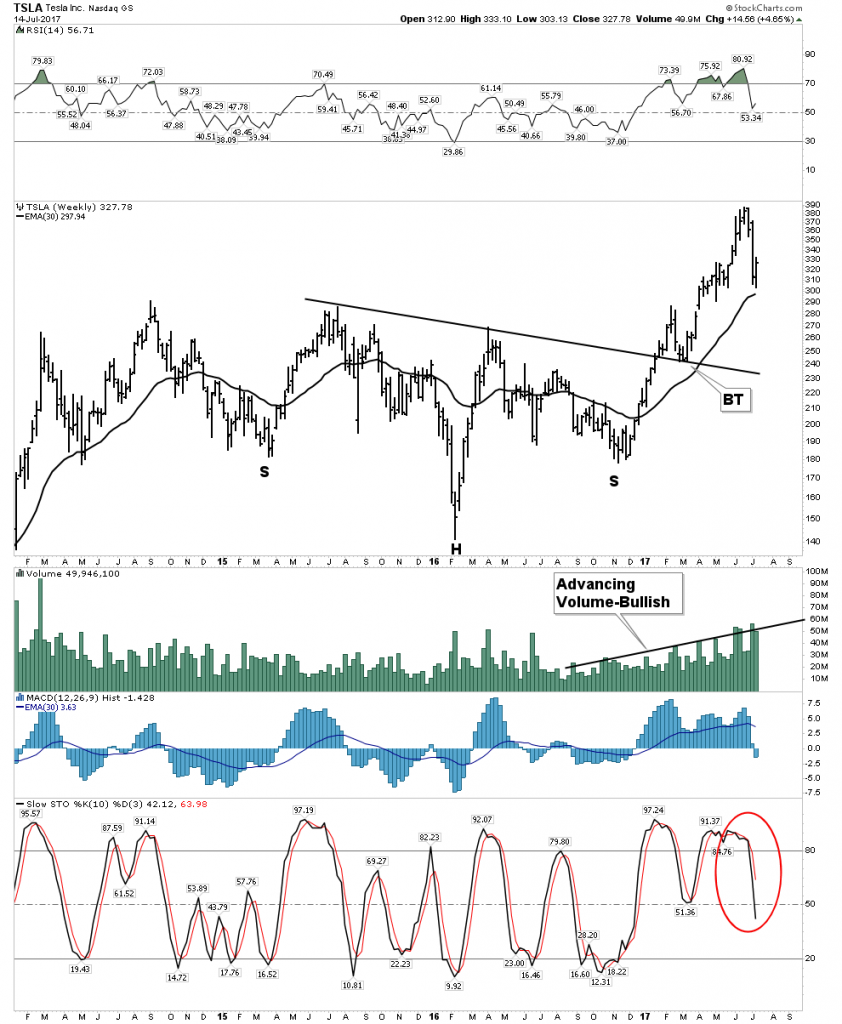
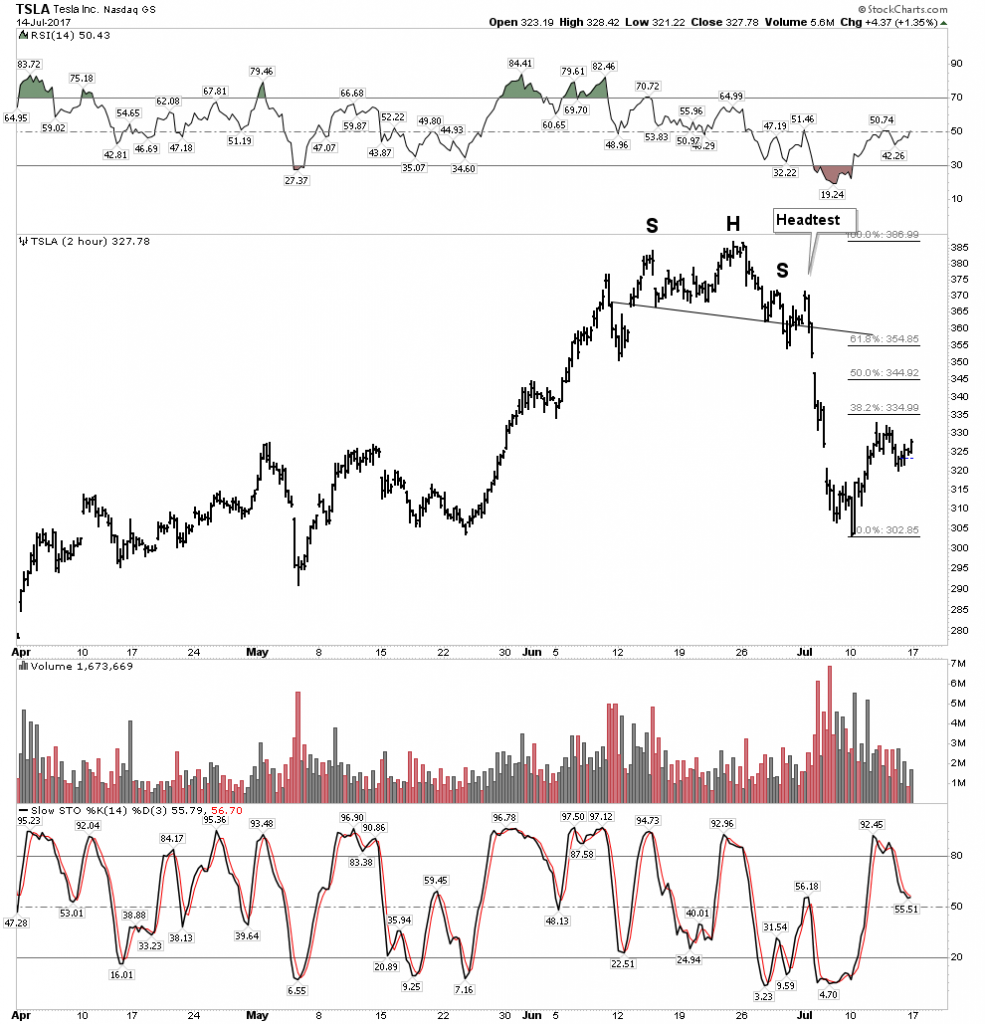
And our special Pied Piper of Kool-Aide stocks TSLA….
I am sorry folks, but I just can’t get on board the Tesla mania-momentum train. The more I look at this company the more and more I see a giant equity fraud. Sure their cars are cool and they really do produce them, but it just doesn’t add up. We have to remember that a stock represents equity and ultimately an equities price must reflect the value of the free cash flow it can produce. That’s where this thing eventually comes off the rails. Here we have a megalomaniac CEO who likes to give speeches about living on Mars, meanwhile the debt wall looms closer every day. When does the market finally recognize this predicament? Don’t know, but we do know that markets are discounting mechanisms and the stock should tell us first. So we have charts that allow two diametrically opposed outcomes. Is this just a pull back to support or is this the initial bursting of the bubble? That’s your call.
The below weekly chart still has a bullish configuration. The correction held at the 30 EMA so from a pure technical view it’s good,
The Shorter 2 Hr view however just looks too bearish for me.
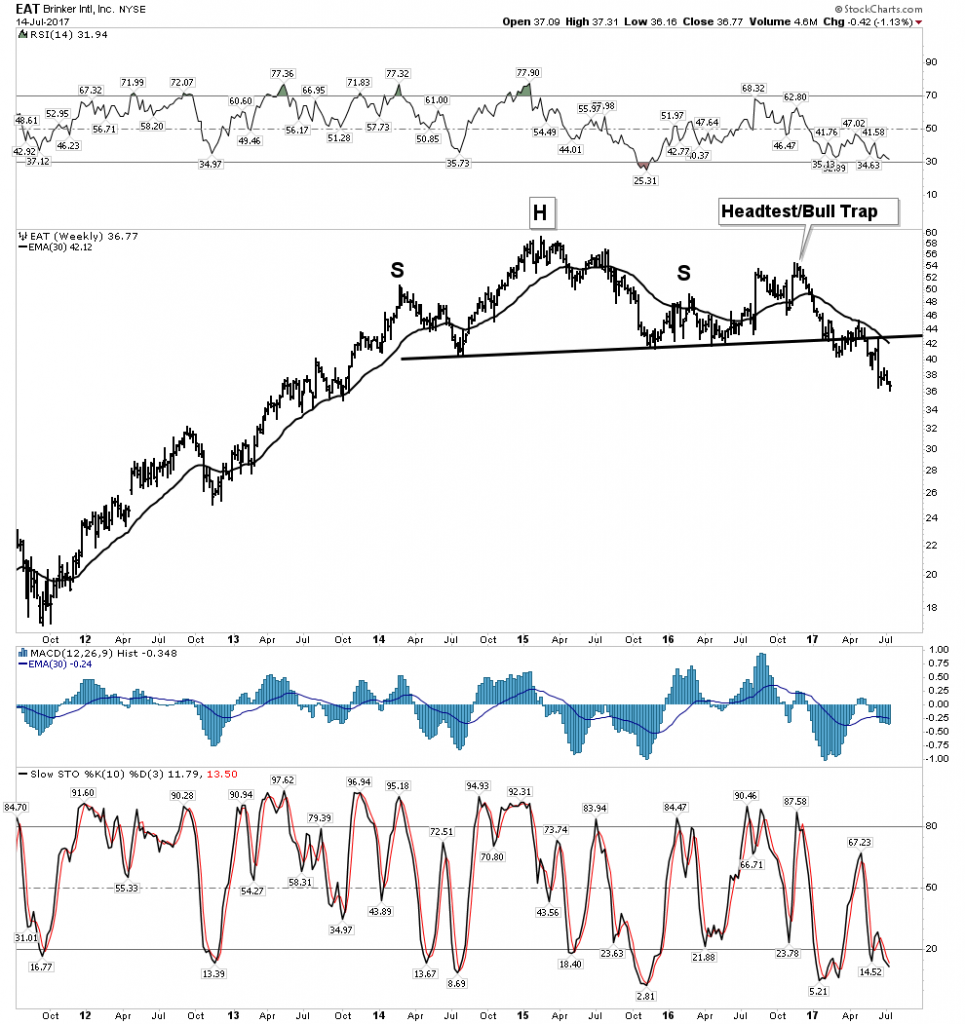
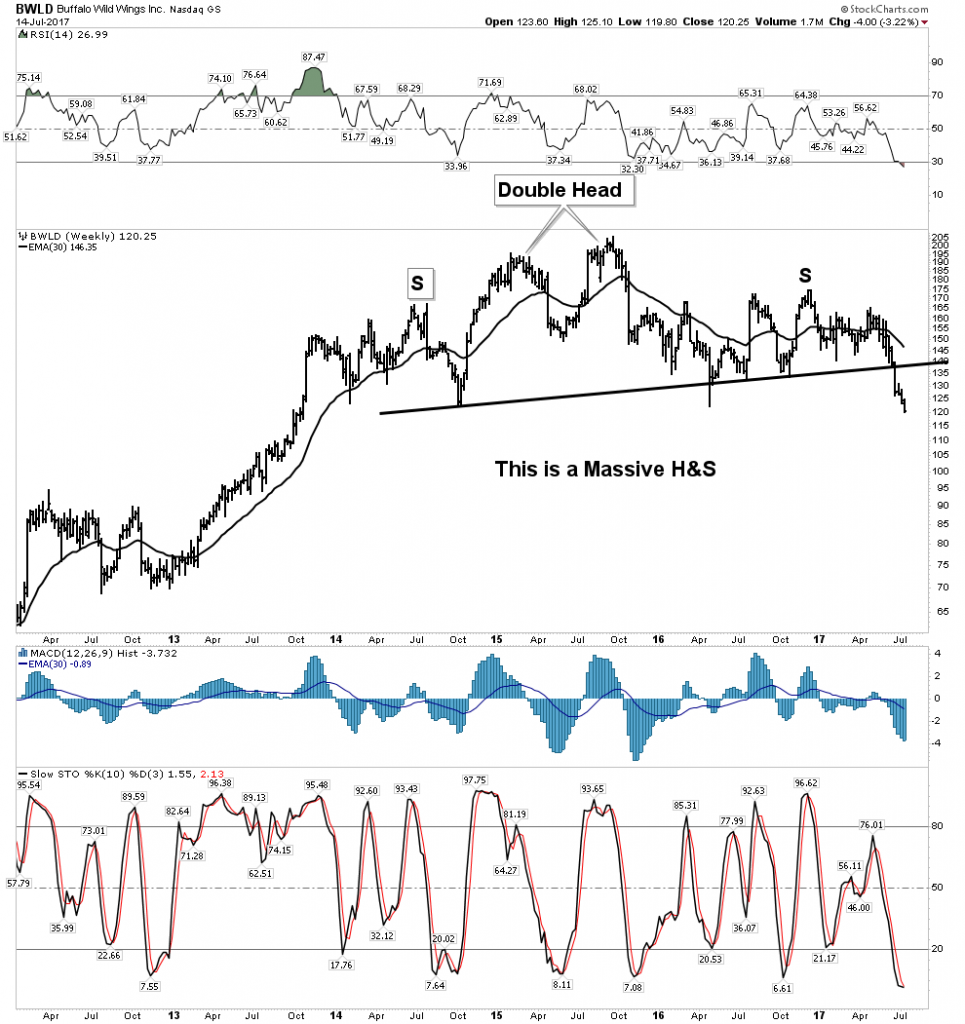
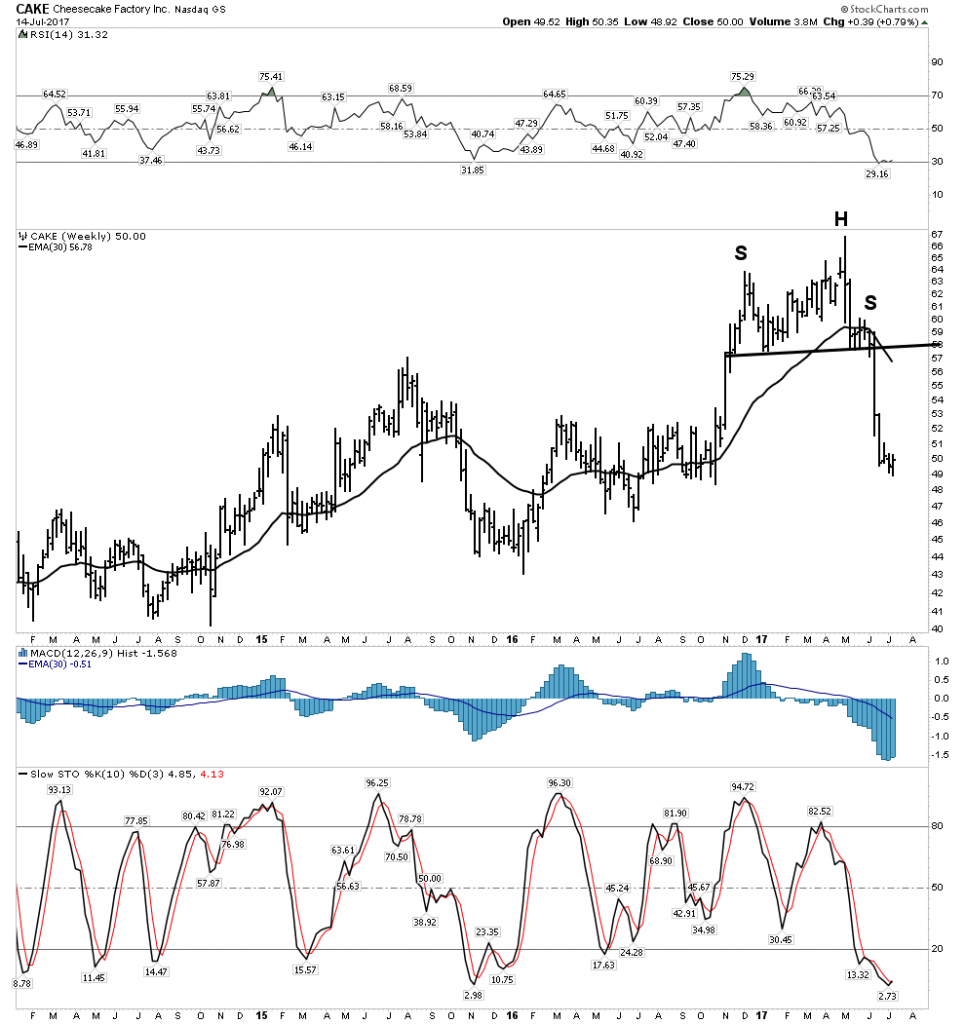
Restaurant watch: These babies are just getting started
Takeover Watch
Waiting patiently:
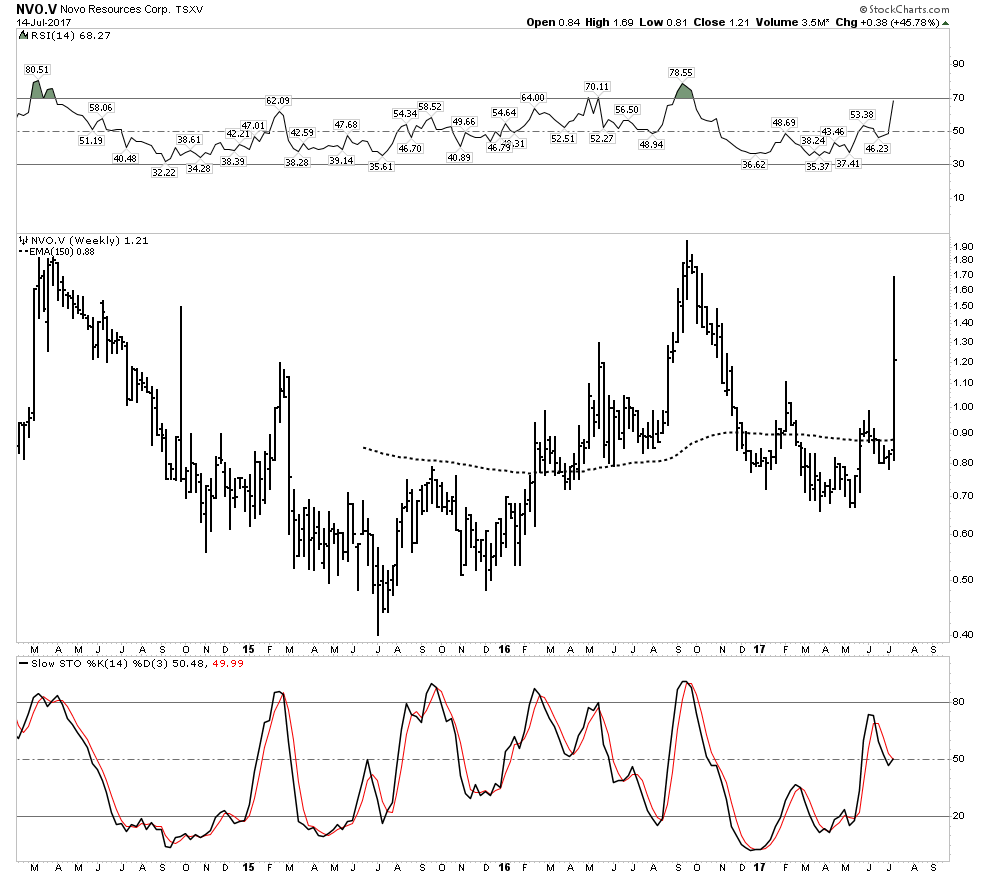
Stock of the Week- Novo Resources
This has the potential for a major discovery
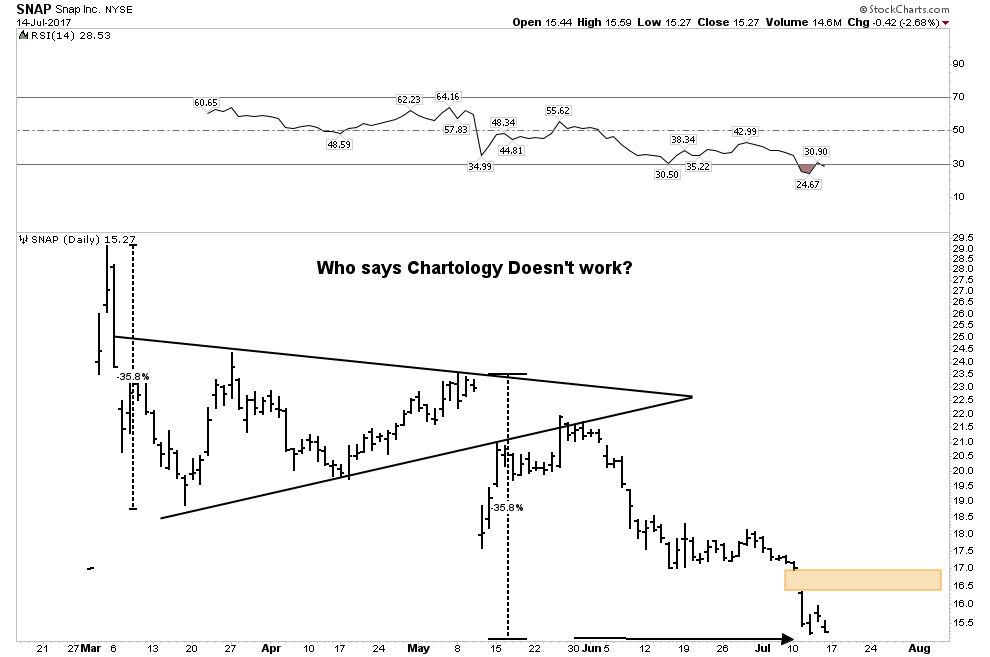
Dog of the Week-SNAP
Pretty pure and simple-chartology wise
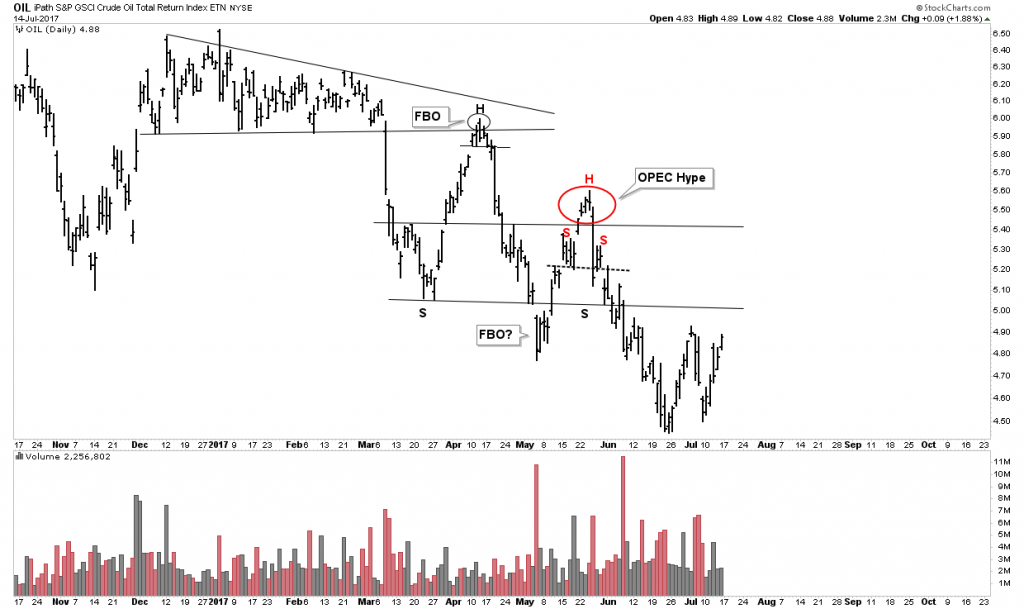
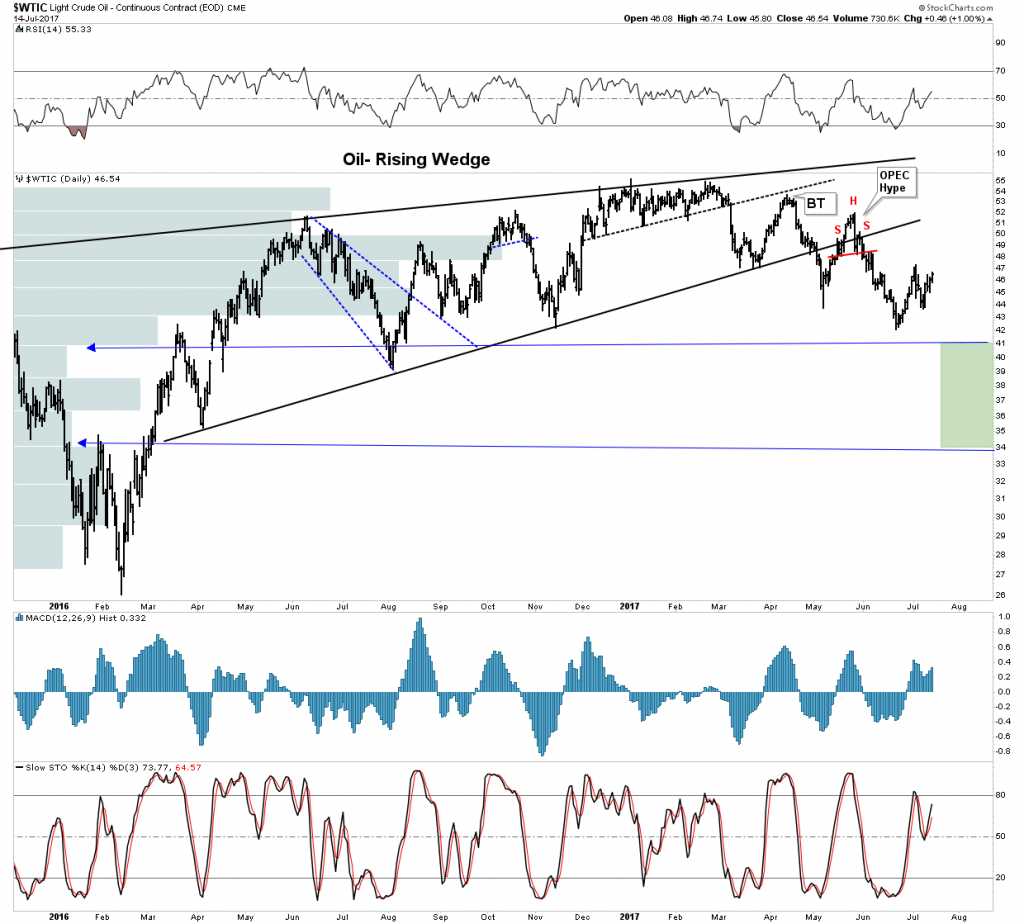
Plunger’s Big Trade- Oil Short
I am currently out of this trade for now. I will reenter as soon as the upside has run its course. I see oil staying firm into August, however, the fall season should bear fruit for this trade. It’s been great so far:
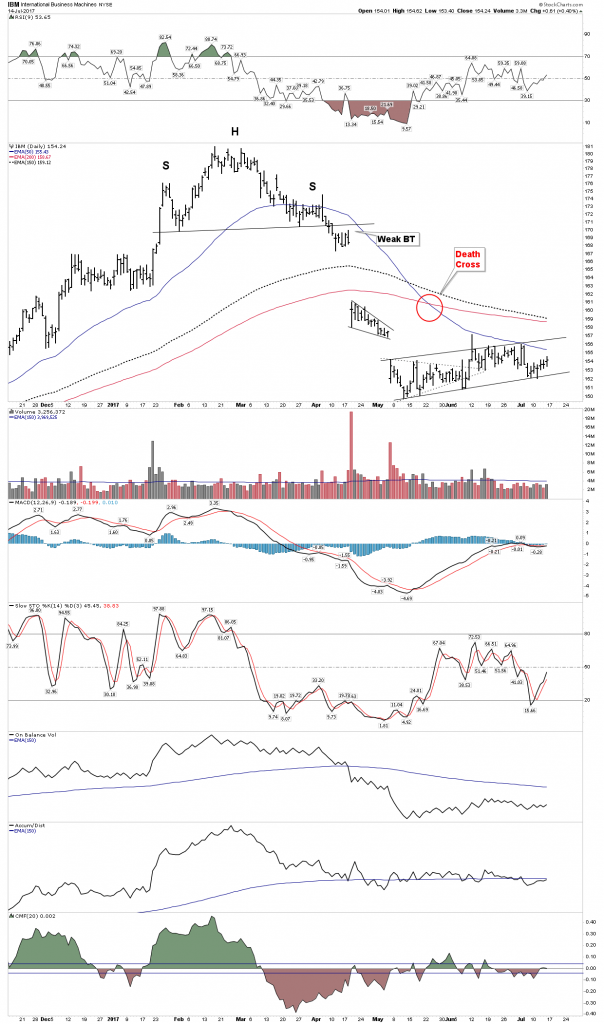
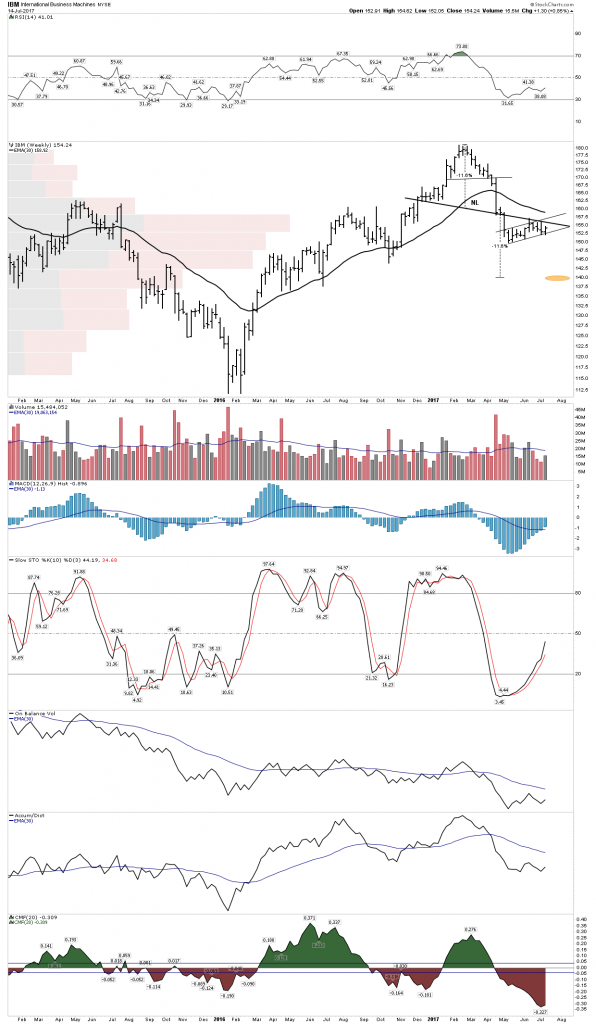
Plunger’s Short Corner- IBM
I have big expectations for this short. It’s playing out to chartology form. It looks to me like it is simply marching in place extending out its bear flag. At some point, it should give it up and fall out of the flag. I am being patient.
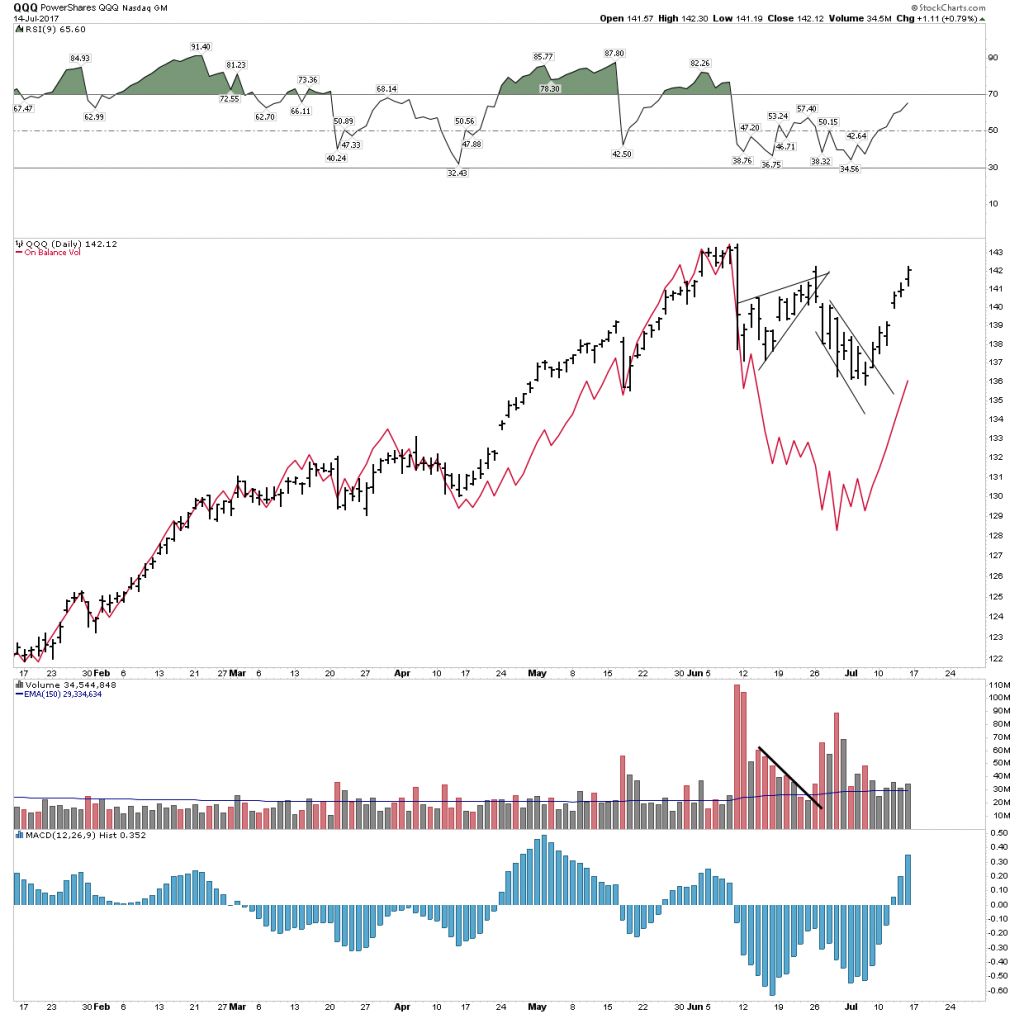
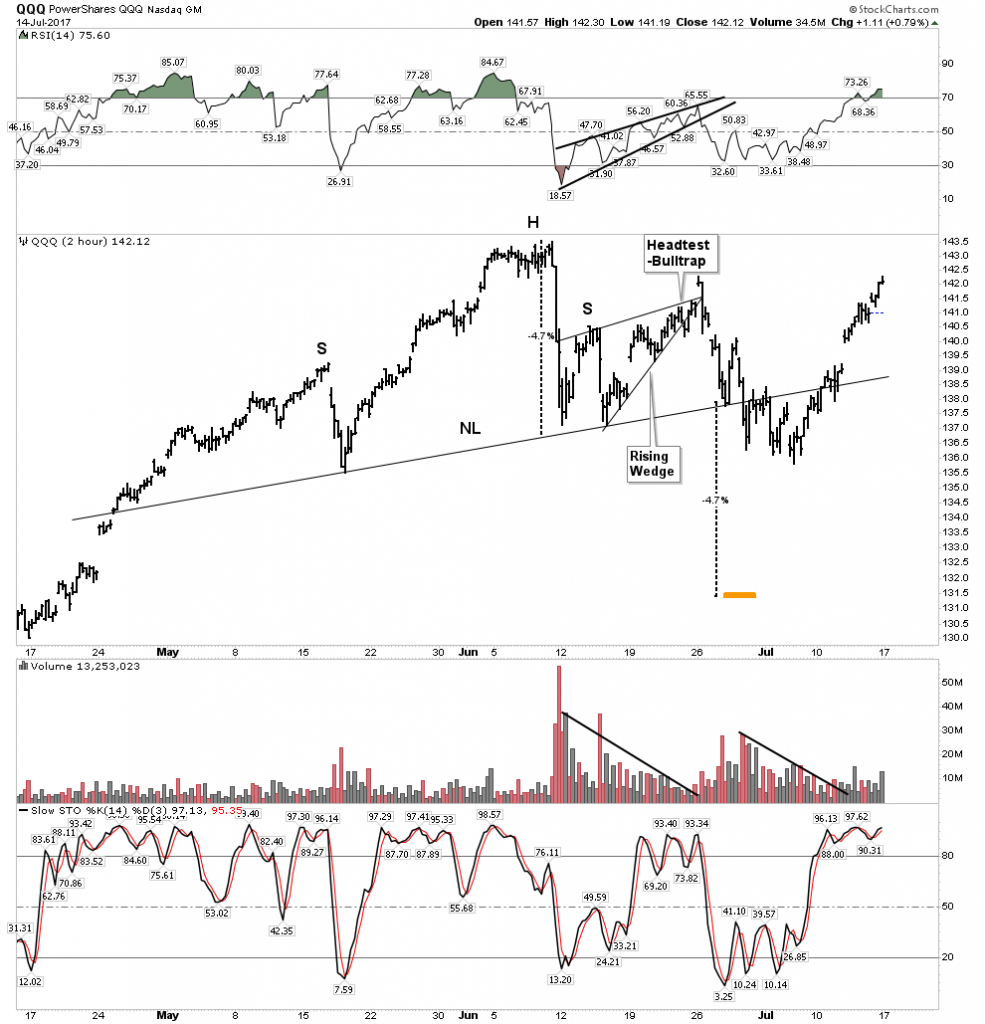
QQQ Short
I covered my QQQ short. It was a gallant try but the deep follow through I had looked for was aborted with Janet’s speech sparking what I see as a short squeeze. That’s the risk of shorting particularly in the early phases of a decline off the top. I may revisit the trade later on after the summer season is over. For now, we may be set-up for more of a squeeze to higher highs. Note the squeeze has been on weak volume.
But remember the principle: Losers let losers run. Again. I covered.
Uranium
The public is fearful of bargains– J. Paul Getty
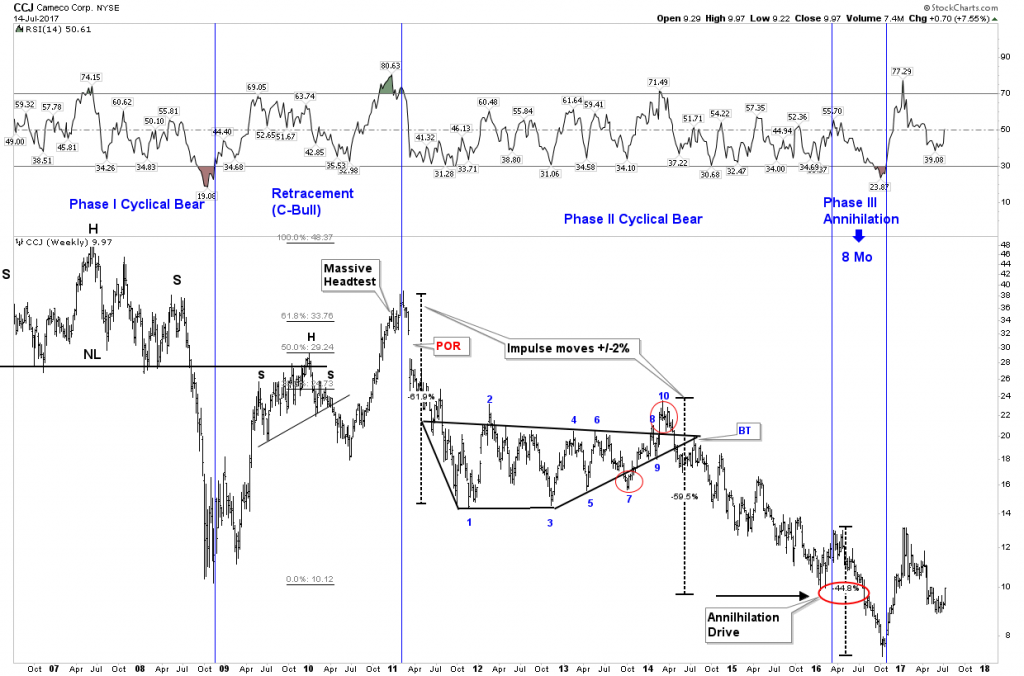
As I mentioned in my uranium report a few months back, it is in a complex stage 1 bottoming formation. It has not broken into a stage 2, however, the price action of late has been very encouraging. Take a look at my long term CCJ chart. It is a proxy for the industry. Could it finally be putting in its low? Is the action over the past 2 years a massive inverse H&S
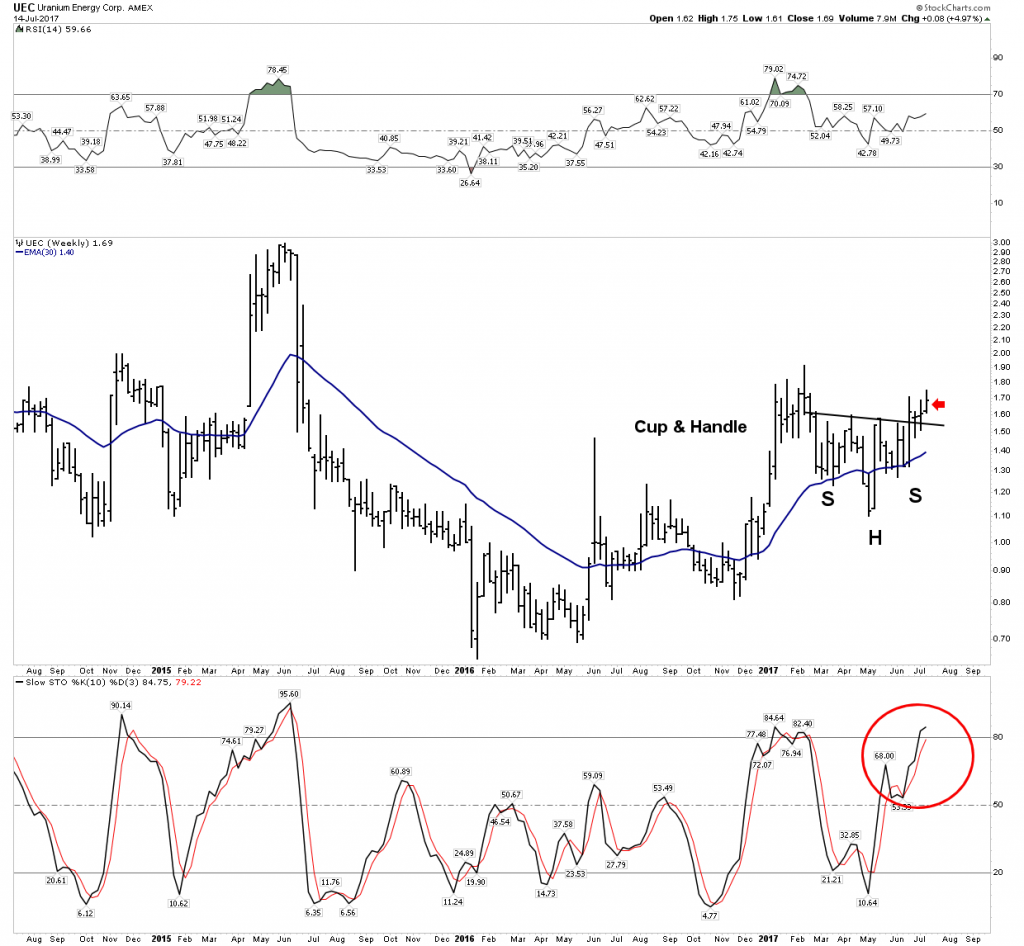
UEC looking strong
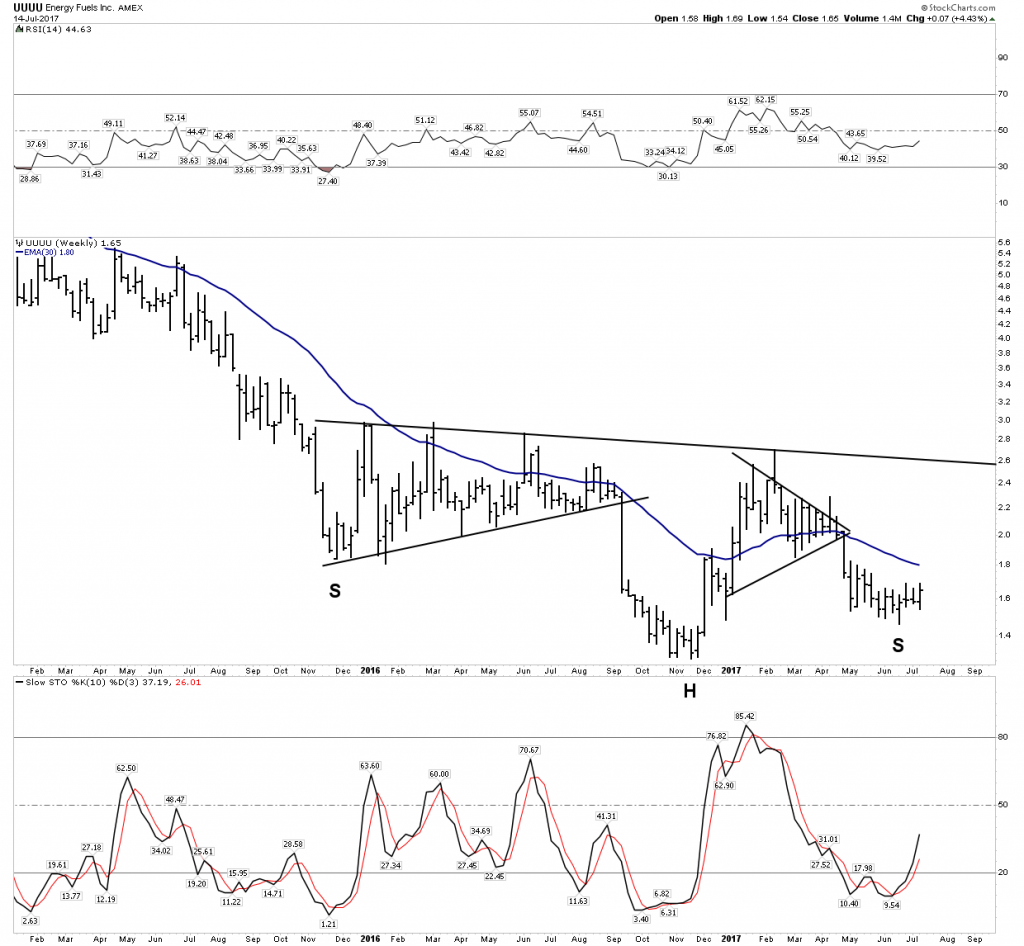
UUUU- Tracing out a bottom?
The ETF- looking promising
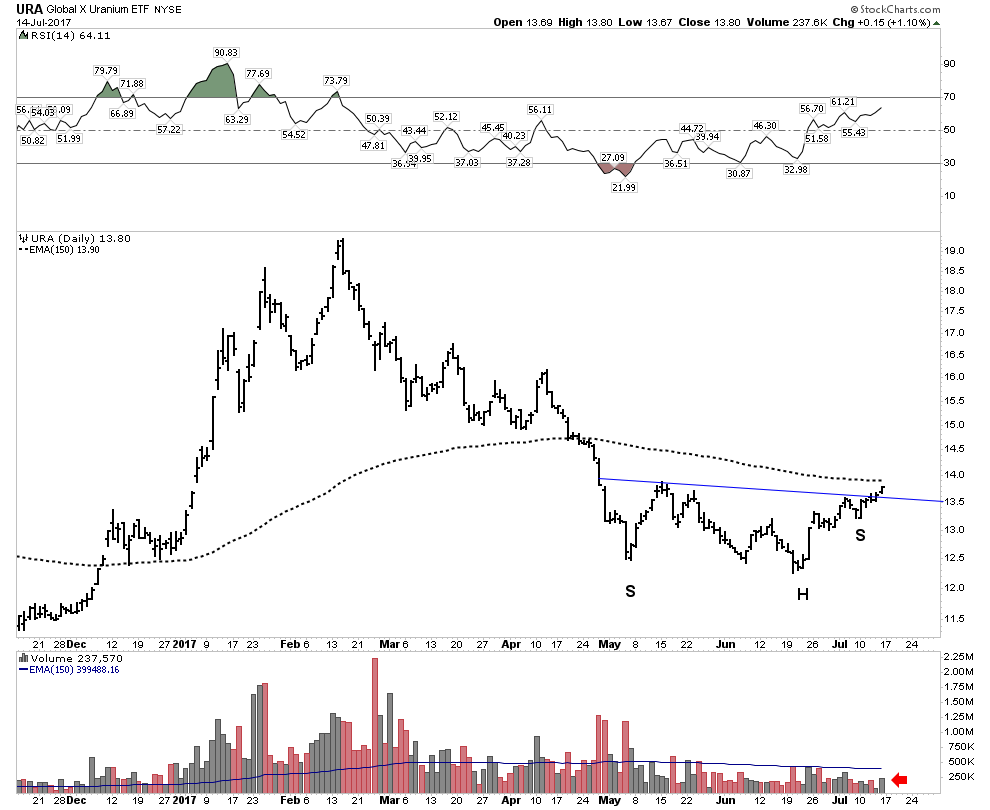
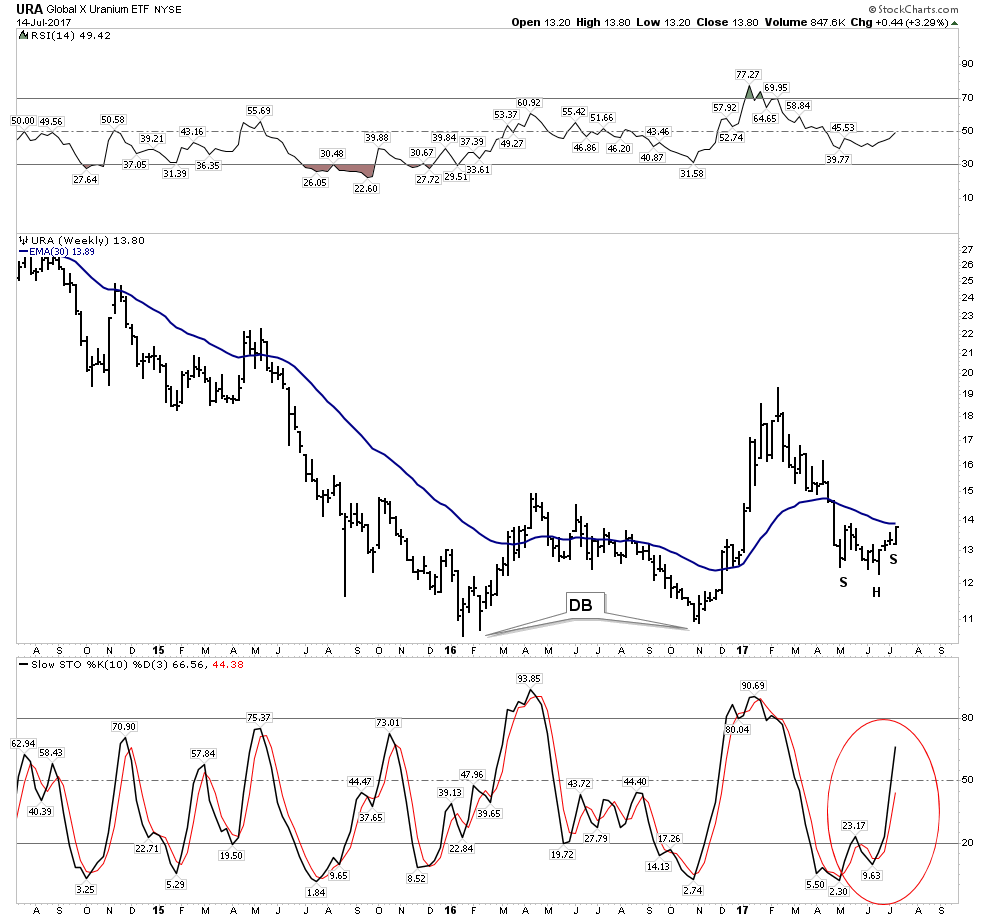
Bottom line on uranium is this is a bull market in waiting. It’s just a question when it makes its transition from stage 1 to stage 2. The action in numerous shares is what this transition should look like. It’s not complete yet, but has the potential to surprise in a hurry.
In the next weekend report, I would like to take a look a little closer at the tightening geo-political aspect of markets. Not interested in the politics, but the investing angle. If things get more inflamed what would be the opportunities? And its a bit deeper than just saying buy Raytheon. A lot can happen in two weeks.
Invest aggressively, but preserve capital.
Disclosure: None.


thanks much for sharing