
Why 2017 Looks Nothing Like 1929 Or 1987
Trends take all factors into account, including valuations, earnings, Fed policy, and geopolitics. ADX is a technical indicator developed by Welles Wilder to monitor trends. From stockcharts.com:
The Average Directional Index (ADX) measures trend strength without regard to trend direction. The other two indicators, Plus Directional Indicator (+DI) and Minus Directional Indicator (-DI), complement ADX by defining trend direction. Used together, chartists can determine both the direction and strength of the trend.
Extended Trends Are More Vulnerable
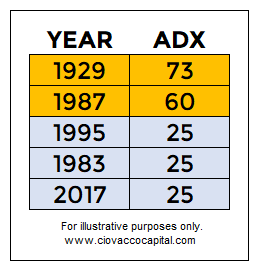
Monthly ADX figures for the S&P 500 since the mid-1920s have all fallen between 10 and 75. According to Wilder, a sleepy or trendless market is in place when ADX is below 20; a strong trend is in place above 25. As shown in the table below, very high ADX readings tell us a market is extended and it is time to pay closer attention.
A Detailed Look At ADX: 1929/1987 vs. 2017
This week’s stock market video describes ADX in more detail and asks what can we learn about the market’s long-term risk-reward profile.
ADX Helps Us Assess Odds
Like any technical indicator or data point, monthly ADX should not be used in isolation. In bull markets, ADX helps us answer the question, is the market currently trendless, trending, or extended? If the answer is “extended”, ADX tells us to focus on shorter-term measures of market health and to have a prudent exit strategy in place.
Disclosure: This post contains the current opinions of the author but not necessarily those of Ciovacco Capital Management. The opinions are subject to change ...
more

