
What Happened To Stocks When The Fed Funds Rate Increased?
When it comes to the Fed funds rate hike it’s not a matter of if, but when. While the “when” part is anyone’s guess (the consensus now seems to be September but who knows) the fact that a rate hike may be nearing has investors on edge. The main reason being that the Fed Funds rate has been stuck at 0% since December 16, 2008, over six years ago. And even though the employment statistics have recovered quite a bit since those gloomy days of 2008, the economic growth statistics (mainly GDP) have left a lot to be desired in this slow recovery. So the fear is if the economy can barely make any real progress with 0% rates then any rate hikes spell immediate doom.
Click on picture to enlarge
The purpose of this post is not to give any predictions (no one knows exactly how this all plays out) but to simply review what has happened to stocks during the previous three initial Fed Funds rate hike cycles over the last 20 years (2004,1999,1994). In doing so perhaps we can become prepared for whenever the first Fed Funds rate increase occurs sometime in the future.
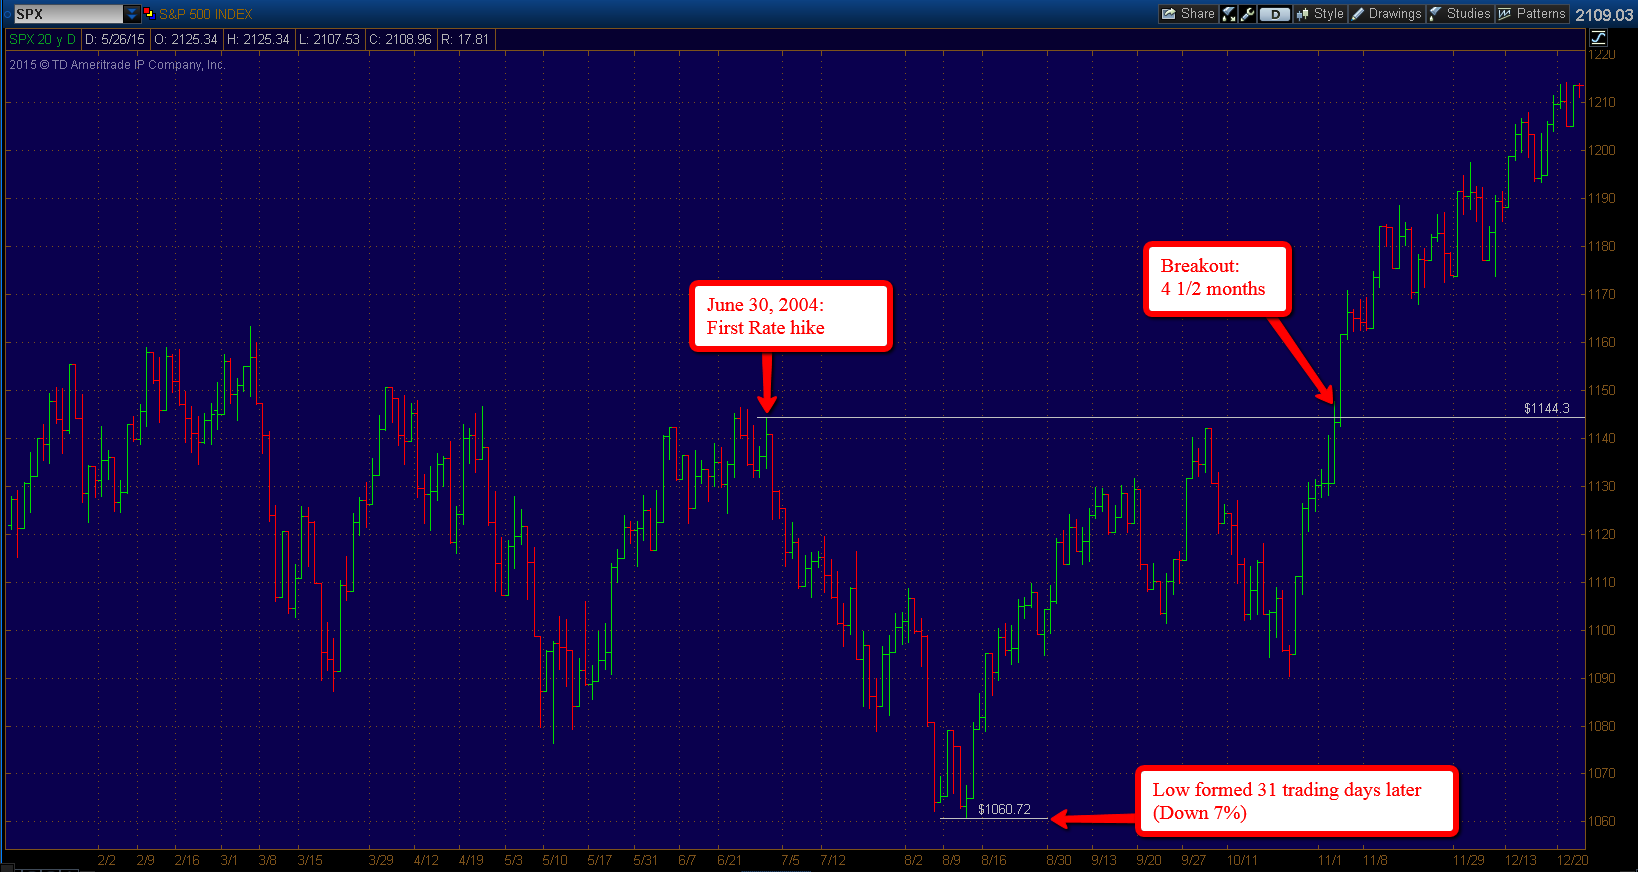
The last major Fed Funds rate hike cycle began on June 30, 2004 (S+P 500 chart above). The Fed Funds rate had gone from 6.50% in year 2000 all the way down to at 1% on June 2003. The market had experienced some volatility leading up to the June announcement, making lower highs and lower lows. The S+P 500 closed up for the day of the announcement but then proceeded to decline for most of the next 31 trading days, where a low was formed some 7% lower. The yield on 10 year US treasury bond’s was 4.7% on June 30, 2004 and fell to 4.0% in November 2004.
It would take the S+P 500 approximately 4 1/2 months to meet and exceed the price levels that were trading at the time of the initial announcement. In November of 2004 the S+P 500 continued it’s rally to new bull market highs, at that point there were three additional rate hikes so the Fed Funds rate was then at 2.00% as the market continued it’s rally.
Click on picture to enlarge
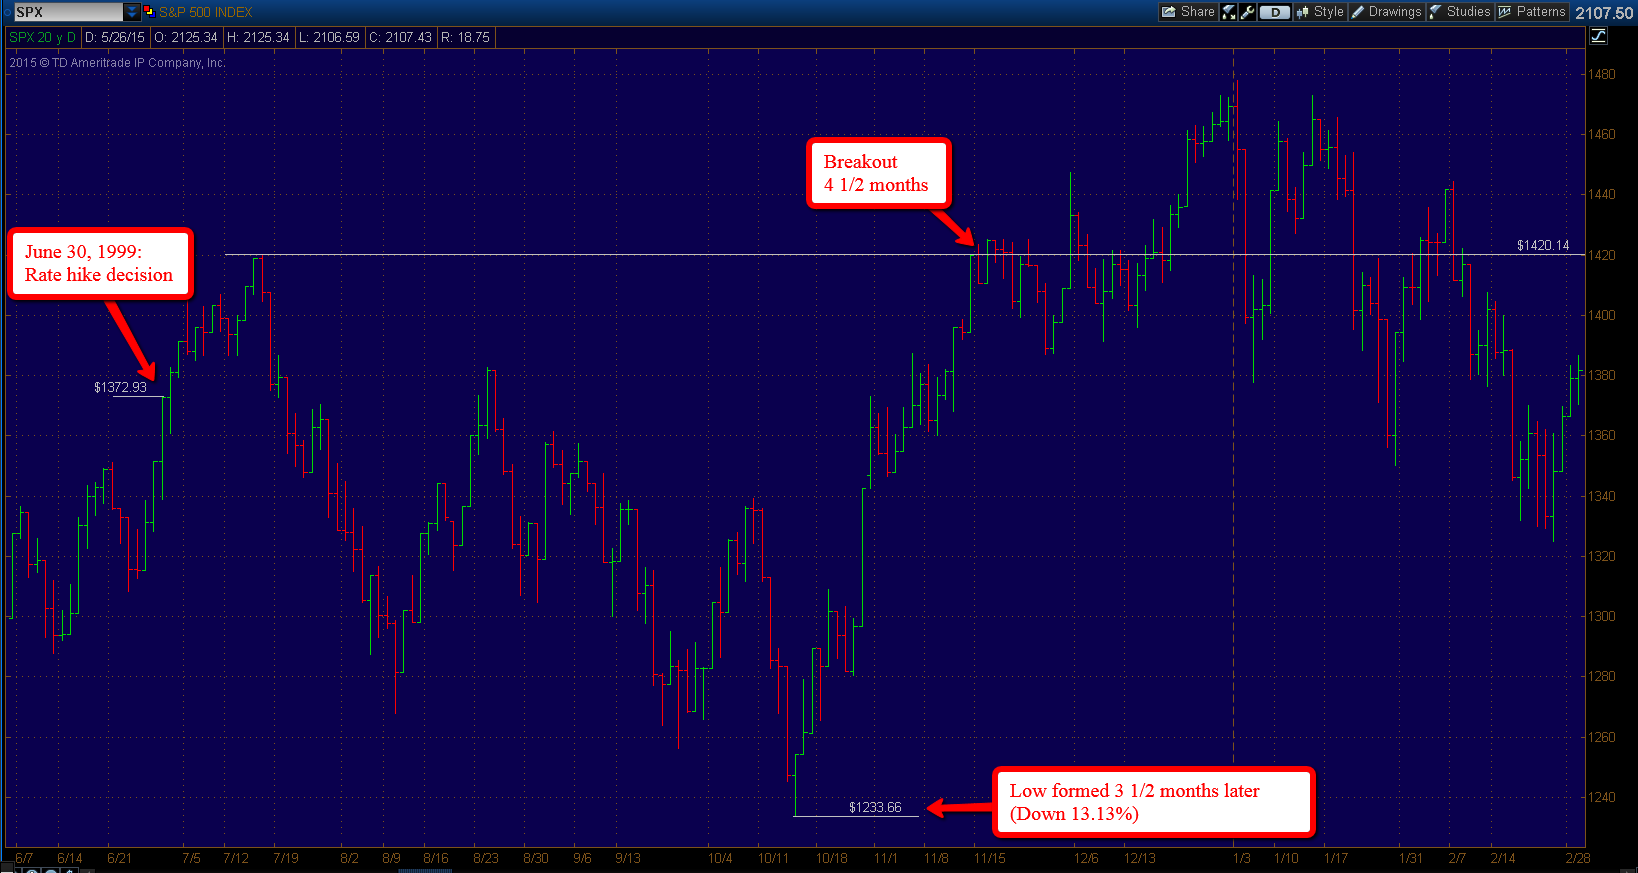
The next recent initial rate hike cycle also came on June 30 but the year this time was 1999. The Fed Funds rate had dropped from 6% in 1995 to 4.75% in 1998 (with one 25 basis point increase in between). The yield on 10 year Treasury Bonds on June 1999 was around 6%.
Again we see that the S+P 500 closed positive on the day of the announcement and in this case the market continued to rally about 4% higher until eventually topping out in the short term. What proceeded over the next 3 1/2 months was a drop of about 13% until a low was formed in October 1999. The bounce back was quite sharp and about a month later (4 1/2 months after announcement) the S+P 500 was making a new bull market high.
During those 4 1/2 months after the initial announcement there were two additional rate hikes, taking the Fed funds rate up to 5.50% by the time of the breakout. The yield on 10 year treasury bonds was hovering around 6% in November 1999.
Click on picture to enlarge
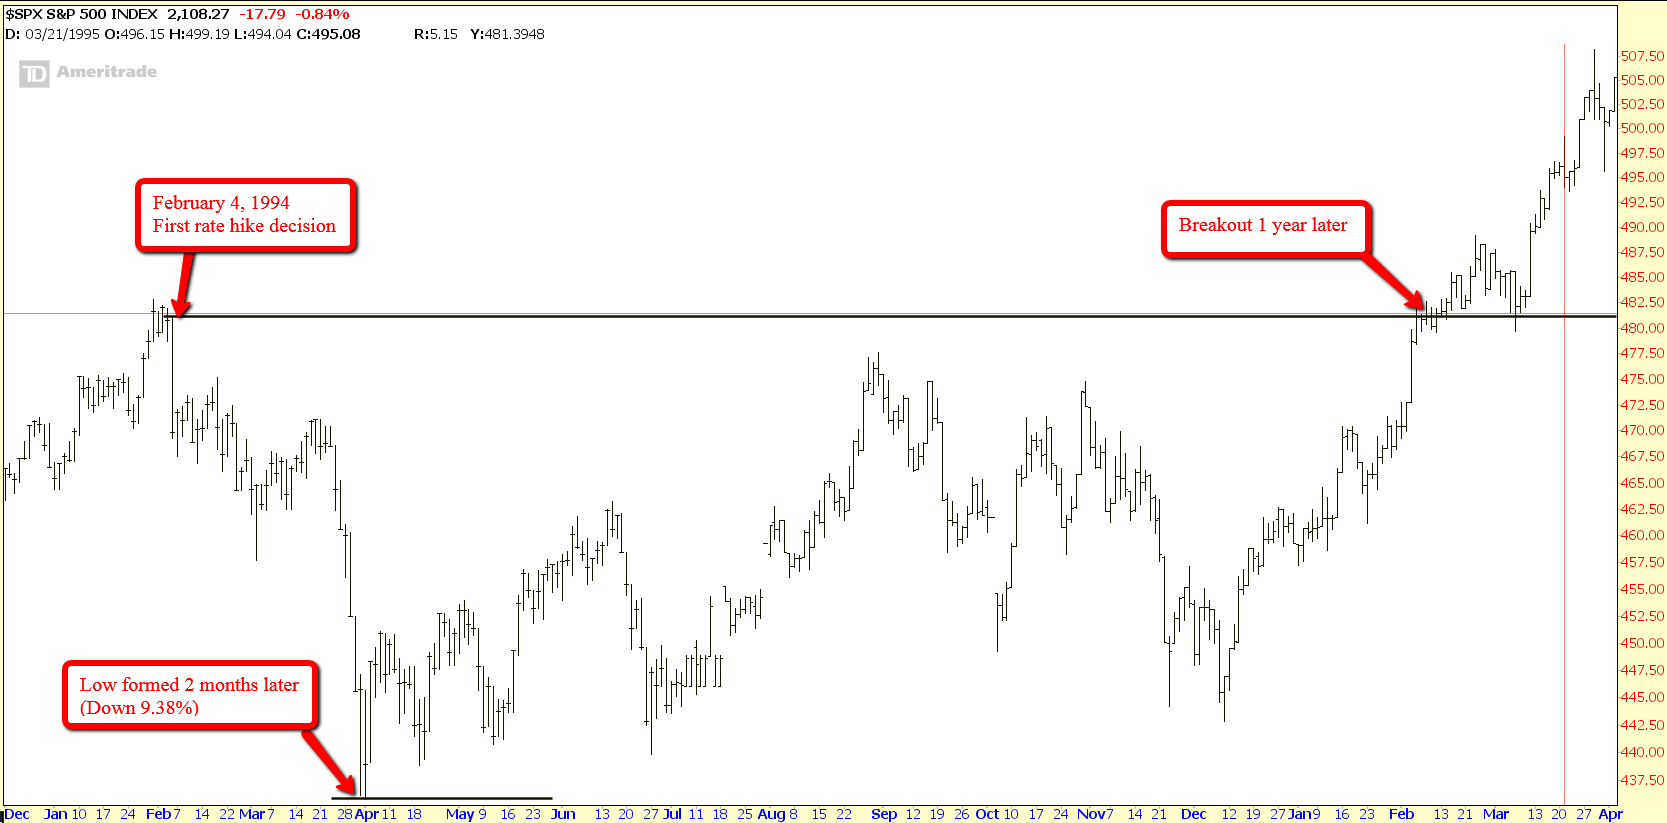
The next initial rate hike cycle was in February 1994. The Fed Funds rate had gone from 9.75% in 1989 down to 3% in September 1992. The yield on 10 year Treasury Bonds was 5.98% on February 1994.
In this case the market immediately sold off on the announcement of the first Fed Funds increase in five years. And proceeded to continue the sell off over the next two months until a low was formed around 9.38% lower. It would take the S+P 500 almost a year recover from the losses. There were six additional rate increases during this time frame and the Fed Funds rate was 6% when the S+P 500 made it’s new bull market high. The yield on 10 year Treasury bonds 7.46% at the time of the breakout.
So what have we learned? It’s true that stocks have suffered short term volatility during each of the last three initial rate hikes. But it is also true that the markets eventually stabilized and continued their uptrend, making a new high within a year or less. I have no doubt that when that first rate hike occurs and we see any negative reaction in markets, that many pundits will scare investors completely out of their long term plans.
Sure it’s possible that the first rate hike kicks off a bear market (it’s been so long since we have even had a serious correction) after all, we have been stuck at 0% for over six years with global QE. There really isn’t any finite blueprint on what to expect after such easy monetary policy conditions, in terms of initial rate hikes.
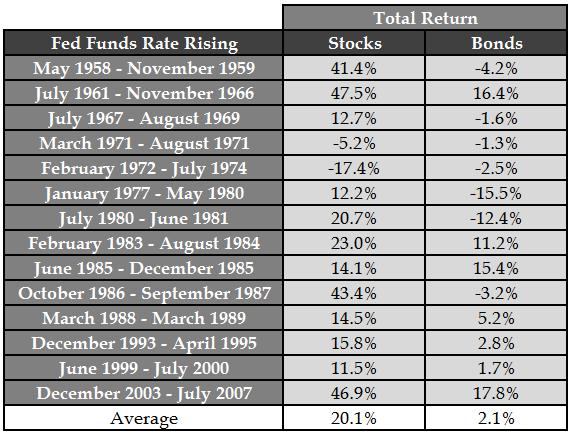
What we can quantify is the total returns during each of the Fed Funds increase cycles. This excellent chart comes from Ben Carlson over at A Wealth of Common Sense. This shows that stocks have actually returned an average of 20% during Fed Funds rate increase cycles going back to 1959 and there were actually only two times (1971, 1974) were stocks were down.
In summary; expect some short term volatility when rates eventually go up and plan accordingly.
Sources:
Disclosure: None.


