What A Flattening Yield Curve Means For Core Fixed Income
Trade-offs in the Agg
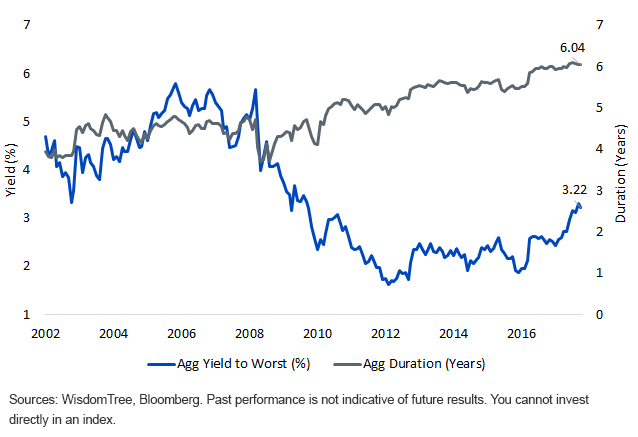
As the Federal Reserve (Fed) continues its balance sheet unwind and gradual raising of short-term interest rates, one underappreciated market dynamic is the consistent march higher in duration for bond benchmarks such as the Bloomberg Barclays U.S. Aggregate Index (Agg). At over six years, this implies that increases in interest rates now cost investors 50% more than in 2008, when duration was around four years. Combined with still historically low levels of income, this remains a particularly difficult risk/return trade-off.
Figure 1: Historical Agg Index Yield and Duration, 8/31/02–5/31/18

Why Is the Yield Trade-off So Advantageous?
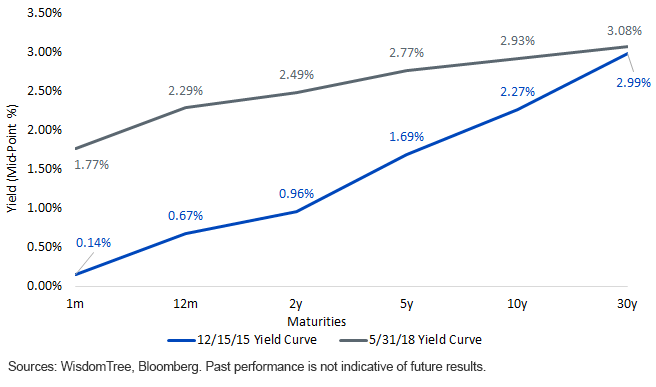
While all tenors have increased in yield since the Fed began raising rates on December 15, 2015, the longer end of the curve has not moved in proportion to the shorter end of the curve. As the yield curve “flattens,” the opportunity cost of extending duration goes down. Not making this trade implies that investors think rates are either going to stay steady or fall.
In short, a flatter curve implies a lower opportunity cost of reducing rate risk.
Figure 2: U.S. Yield Curve on 12/15/02 and 5/31/18

WisdomTree Barclays Yield Enhanced U.S. Short-Term Aggregate Bond Fund (SHAG): Maintain Income, but Cut Duration in Half
While investors have many options to tackle interest rate risk, they generally involve a significant sacrifice in yield. WisdomTree provides a pragmatic solution: SHAG, which tracks the Bloomberg Barclays U.S. Short Aggregate Enhanced Yield Index (Short Agg Enhanced Yield). Here’s how it works:
- Starting with the core universe of U.S. investment-grade bonds (the Agg).
- Systematically reduce overall interest rate risk by limiting inclusion to only the one-to-five-year maturing segment of the market.
- Within predefined risk constraints, it compartmentalizes the market and tilts toward the best-yielding opportunities. Historically, this has meant being over-weight in credit and under-weight in Treasury bonds.
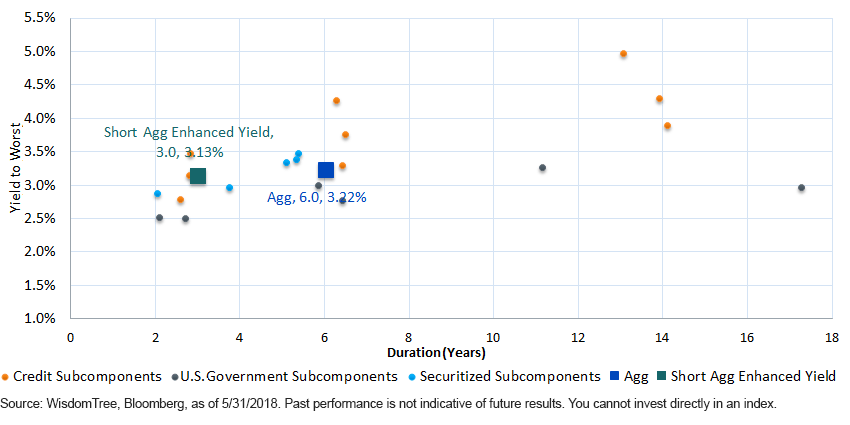
By removing the long-dated maturing bonds while enhancing for yield, you can have your proverbial cake and eat it too, without eliciting the use of niche fixed income instruments. By sacrificing only 9 basis points (bps) in yield, you can cut your duration in half compared to the Agg. Additionally, since the duration is lower, the volatility is also lower. Since inception, SHAG has averaged about half the volatility of the Agg (1.17% versus 2.37%, respectively).
Figure 3: Yield and Duration Matrix for the Agg and Short Agg Enhanced Yield

What about the other side of the trade? What happens if the yield curve steepens? In this environment, we believe SHAG outperforms even more. This is driven by the fact that steepening in the curve is almost solely dictated by longer-term rates rising faster than short-term rates. Given the Agg’s longer duration, it gets hit even harder. Effectively, investors are being paid disproportionately to the amount of extra duration risk they are taking on.
As SHAG just crossed its live one-year mark on May 18, 2018, let’s look back over this year to see how it has performed when put to the test. During this time frame, the U.S. 10-Year interest rate has increased 83 bps, as SHAG and SHAG’s underlying index outperformed the Agg index by 51 bps and 83 bps, respectively. Year-to-date (YTD), SHAG and SHAG’s underlying index are outperforming the Agg by 138 bps and 164 bps, respectively.1
For illustrative purposes only, an interesting thought exercise is if we hypothetically assume interest rates stay steady for the rest of the year, what could one potentially expect from the Agg and SHAG for their 2018 total returns? The Agg’s total return for 2018 would have approximately a negative return (-1.50% return YTD currently + current levels of income estimated for the remainder of the year), whereas SHAG could approximately generate a potential positive return (-0.51% return YTD currently + current levels of income estimated for the remainder of the year). Given the Fed’s transparent rate policies, it is not far-fetched to say we can continue to see more rate hikes and a continued flat/flattening curve in the months ahead.
We believe it is vital for bond investors to think about how and where they are making their “bets.” By maintaining exposure to investment-grade credit and being exposed to the shorter end of the curve, core fixed income investors can tilt risks in their favor as they navigate increasingly rate-sensitive markets.
Unless otherwise stated, data source is Bloomberg, as of May 31st 2018.
1Source: Bloomberg, as of 5/18/18.
Disclaimer: Investors should carefully consider the investment objectives, risks, charges and expenses of the Funds before investing. U.S. investors only: To obtain a prospectus containing this ...
more


