
Weekly Market Outlook - Jobs, Sentiment & Gold
BigTrends.com Weekly Market Outlook
It was a typical Thanksgiving week last week... very quiet. Don't get used to it though. The market's activity will perk up again this week as traders get back to their posts. As for which direction that volatility will carry the market, that's a tougher question to answer. The BigTrends TrendScore for stocks currently rests at 82.7 (out of 100), above 60 means the market is in a bullish trend overall on a Daily/Weekly time basis.
On the flipside, the indexes are very much stuck in the middle of their most meaningful trading ranges right now, and are hugging key short-term moving average lines as floors. We at least have to respect the fact that the market is just one bad day away from at least a small dip that could become a big one.
We'll weight the upside and downside below, as always. First though, let's recap last week's and this week's most important economic news.
Economic Data
Despite the shortened trading week, last week was pretty full of key economic data... particularly on the real estate and construction front. It wasn't a terrible month for home sales, but it wasn't great either. Existing home sales fell from a pace of 5.55 million in September to 5.36 million. New home sales ramped up from 447,000 to 495,000 units, though that fell short of estimates. Either way, the growth trend that had been so impressive through 2014 has wobbled in 2015.
Existing and New Home Sales Chart
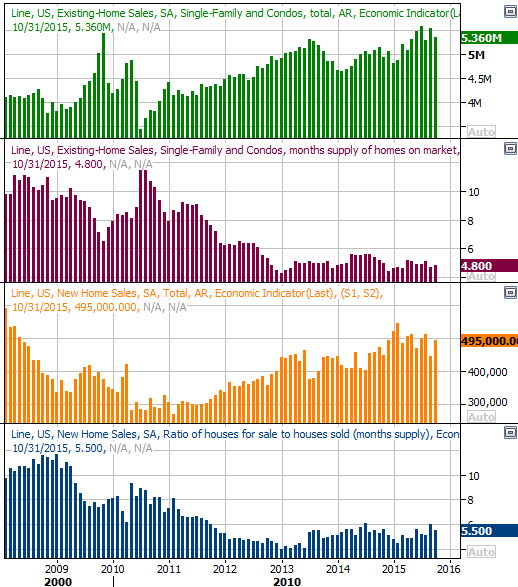
Source: Thomas Reuters
Still, home prices continue to ascend. The FHFA Home Price Index as well as the Case-Shiller 20-City Index were both up as of their September reading, suggesting demand remains reasonably firm.
Home Price Chart
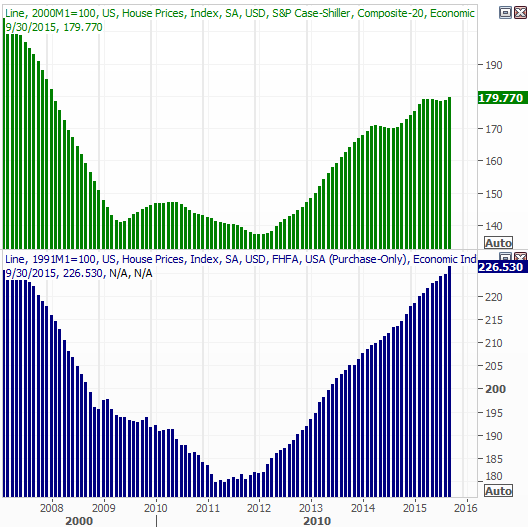
Source: Thomas Reuters
Finally, consumer sentiment has been struggling of late, but really hit a wall last month. The Conference Board's consumer confidence score plunged to a multi-month low of 90.4. The Michigan Sentiment Index edged a little higher for a second month in a row, but is also facing an uphill battle right now. If one or both sentiment readings fall again for this month, that could be a subtle but major headwind for stocks.
Consumer Sentiment Chart
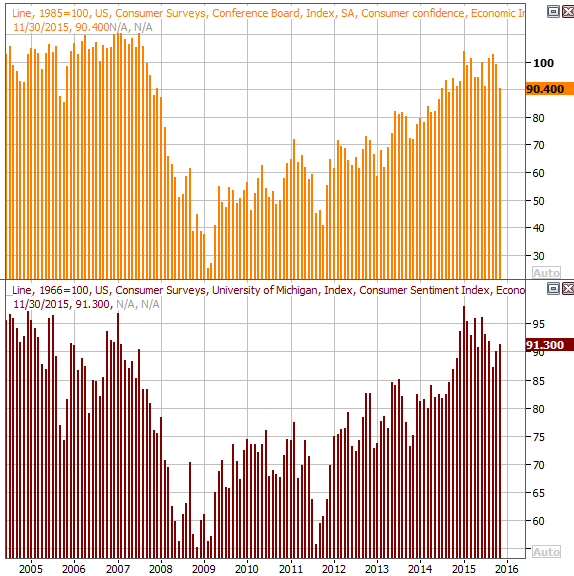
Source: Thomas Reuters
All the other data is on the following grid:
Economic Calendar
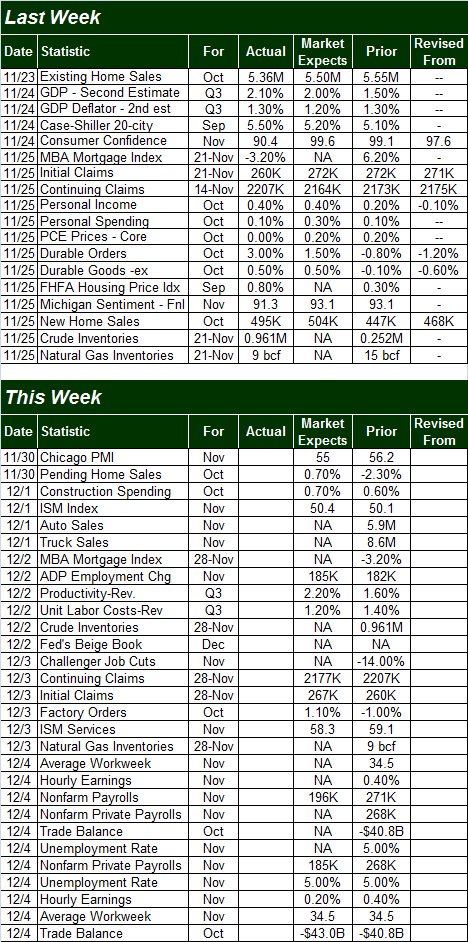
Source: Briefing.com
The coming week will be much busier, but the highlight will clearly be Friday's report of October's employment data. Last month we took a huge leap forward on the jobs-growth front, and a subsequent leap downward (in a good way) on the unemployment rate front. Another good jobs report could seal the deal on a December rate hike, not to mention light another fire under the stock market.
Job Growth and Unemployment Rate Chart
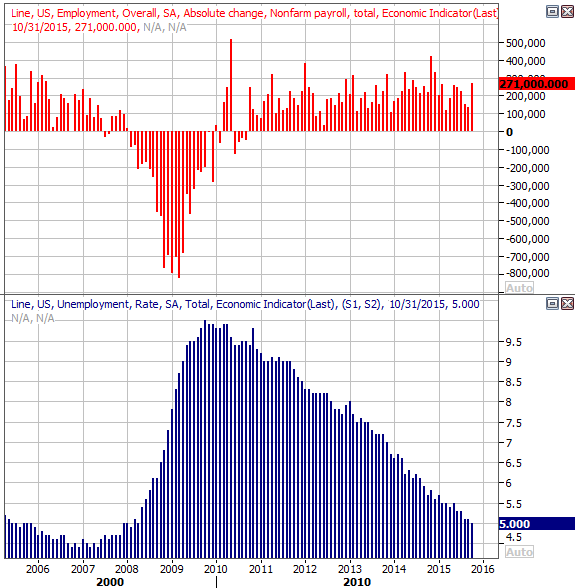
Source: Thomas Reuters
Stock Market Index Analysis
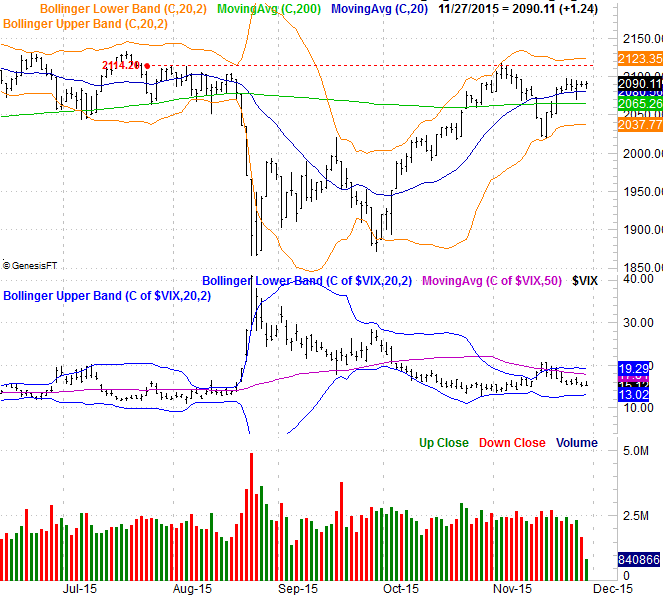
It doesn't take more than a quick look at the daily chart of the S&P 500 (SPX) (SPY) to see just how stale last week was. All told, the S&P 500 gained only 0.94 points, and was never up more than 6.44 points for the week and never down more than 18.88 points.
Aiding in that stagnation last week (aside from the holiday-shortened trading week) was the 20-day moving average line. It's held up as a floor since the 19th. This is all a rather predictable outcome.
The CBOE Volatility Index (VIX) (VXX) not surprisingly moved lower in the shortened holiday week -- but at 15.12 it's still a bit elevated.
S&P 500 & VIX Daily Chart
Chart created with Trade Navigator
You can also see the S&P 500 finished the week - like it started it - right in the middle of its 20-day Bollinger bands. This makes it even tougher to handicap the market. Were the index testing one Bollinger band or the other, we would at least know we were on the verge of a breakout or breakdown, or at least a reversal. Here in the middle of the band lines, the index could easily travel a little in either direction before it was forced to reveal its hand (bearing in mind the 20-day moving average line at 2079 is still providing at least some support).
The daily chart of the NASDAQ Composite (COMP) offers a little more of a near-term trading framework. Specifically, we can see on the NASDAQ's chart that the composite is closer to a breakout than the S&P 500 is, pressing up and into the upper edge of wedge pattern that's been in place since July (dashed). Just a little more upward movement would clear the upper edge of the hurdle at 5198. And, on the chart of the NASDAQ Composite we see measurable bullish momentum; the NASDAQ gained 0.44% last week... quite a bit for a Thanksgiving week.
NASDAQ Composite & VXN Daily Chart
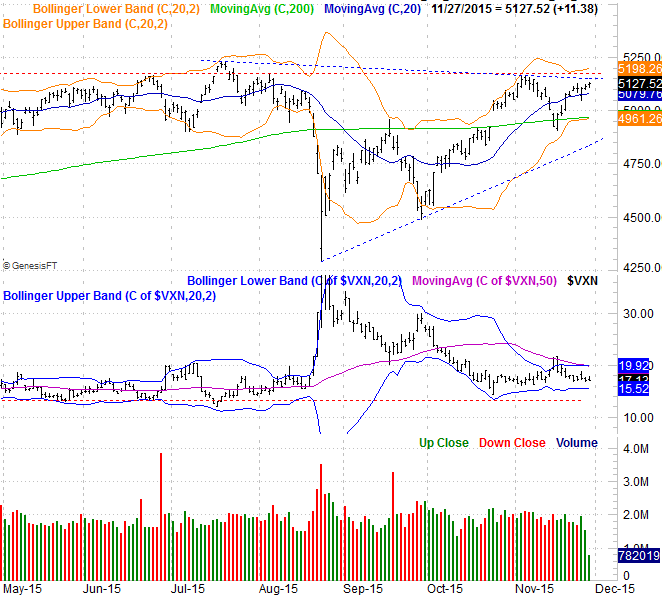
Chart created with Trade Navigator
To really get some perspective on the market right now, however, one has to take a step back and look at the weekly chart of the S&P 500. It's in this timeframe we can see the market is technically back in a bullish mode by virtue of the S&P 500's close back above the 200-day moving average line (green) a month and a half ago. But, you can also see that's a "just barely" situation, and that the 200-day moving average line itself is still sloped downward.
S&P 500 & VIX Weekly Chart
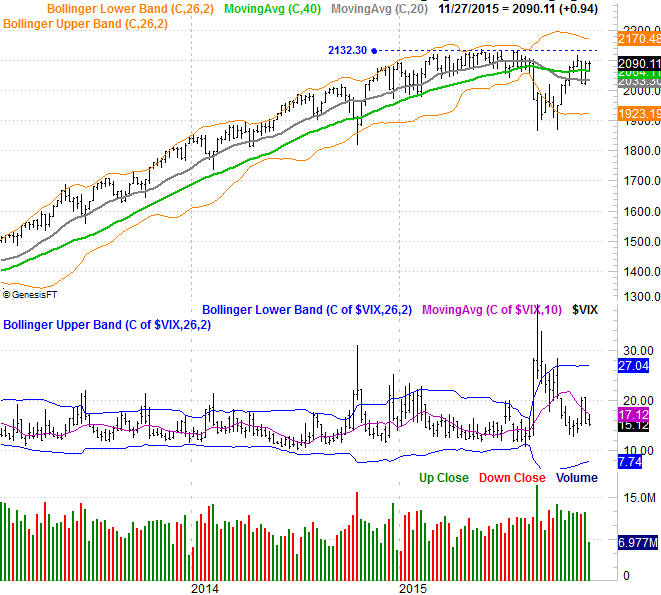
Chart created with Trade Navigator
It's also crucial that the weekly chart of the S&P 500 clears the mid-year peak around 2132 to really convince the bulk of investors that this recovery effort is the real deal.
In the meantime though, the undertow remains a bullish one. Tests of the aforementioned technical ceilings are the more likely outcome from here.
Gold Could Go From Bad to Worse
Though many have called its bottom several times since 2013, Gold (GLD) has yet to actually hit bottom. In fact, it's getting close to another major line in the sand where the floor could fall out from underneath it in a major way. Specifically, the 61.8% Fibonacci retracement line that spans the entire 2000-2011 rally from $442/ounce to $1941/ounce is at $1014, versus gold's closing price of $1057.6/ounce on Friday... and gold is falling fast again.
Gold Futures Long-Term Chart
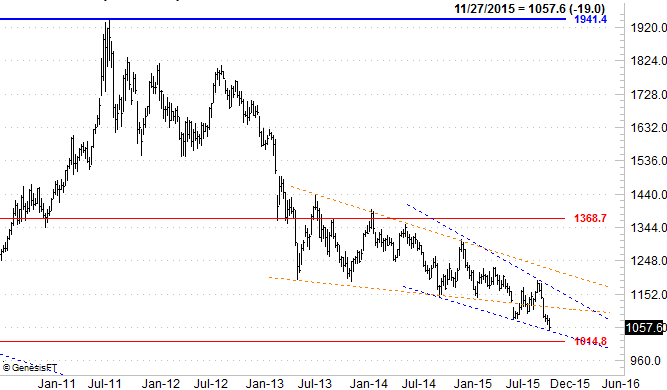
Chart created with Trade Navigator
Gold's recent demise is almost entirely attributable to a soaring U.S. Dollar (UUP), and many say it seems unlikely the dollar could rise any further. They were saying the same thing a year ago though, and the dollar ended up moving quite a bit higher. Never say never. And, if gold's key psychological floor at $1014 should break, that could kick-start a wave of selling. In the meantime, note that gold is trapped in a falling converging wedge (blue, dashed).
Disclosure: None.


