
Weekly Market Outlook - Is The Market Rolling Over?
Weekly Market Outlook - May 2nd, 2016
Following through on the budding bearish effort from two weeks ago, the bears fended off a bullish bounce-back effort over the course of the first half of last week. It wasn't meant to be, however. Between Thursday's and Friday's high-volume selling, the S&P 500 (SPX) (SPY) booked a 1.2% loss last week, and broke below some key support levels in the process. If history is any indication, this stumble may well be the beginning of a more serious pullback.
We'll dissect the rollover effort below, after running down last week's and this week's economic news that will either reverse the selling effort, or exacerbate it.
Economic Data
Last week was pretty busy in terms of economic news. The biggest item, of course, was the Federal Reserve's decision to stand pat on interest rates. Janet Yellen did downplay some economic concerns, though her cheerleading didn't do much to boost stocks.
It was also a particularly important week for real estate and sentiment. We rounded out the week-ago look at the housing market with new-home sales and the Case-Shiller 20-city Index for February, and we got a double-dose of consumer sentiment reports.
As for real estate, the Case-Shiller Index indicated a 5.4% improvement in annualized home values, jibing with FHA data of the same. This has been one of the steadier aspects of the real estate recovery.
Home Price Chart
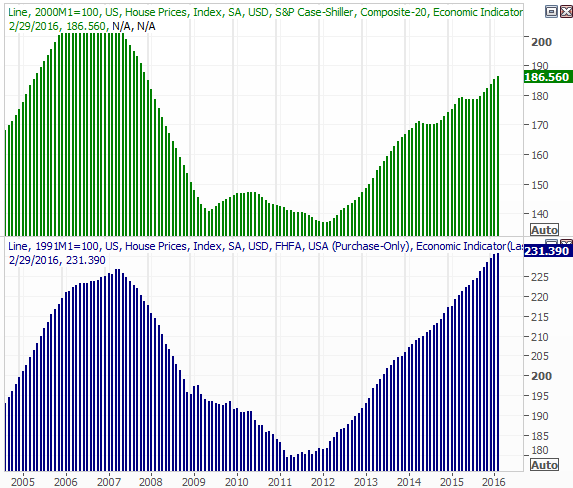
Source: Thomson Reuters
As for home sales, new-home sales was lackluster again last month, at an annualized pace of 511,000 units... more or less where it's been for the past five months. At the same time, it's become clear that new-home inventory is ramping up. It all suggests a tapering in demand. And yet, demand for existing homes popped last month, and the supply of existing homes remains near multi-year lows.
Home Sales, Inventory Chart
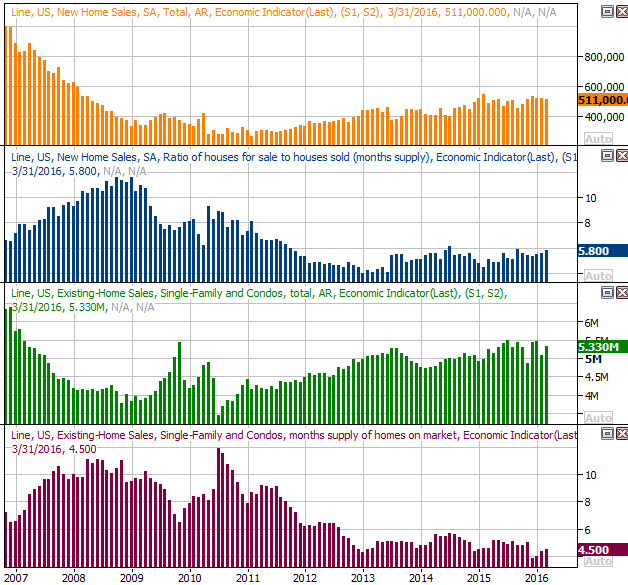
Source: Thomson Reuters
The only other data worth plotting is an updated look at our two key consumer sentiment measures... the Conference Board's consumer confidence reading, and the final April update of the Michigan Sentiment Index. The former fell from 96.2 to 94.2, and the latter fell from 91.0 to 89.0. One monthly pullback doesn't make a trend, but we've seen a string of pullbacks more than a year now. Something has to give sooner or later.
Consumer Sentiment Chart
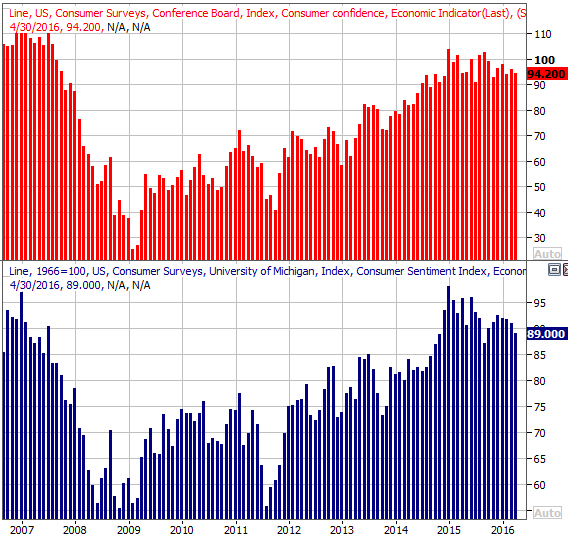
Source: Thomson Reuters
Everything else is on the following grid:
Economic Calendar
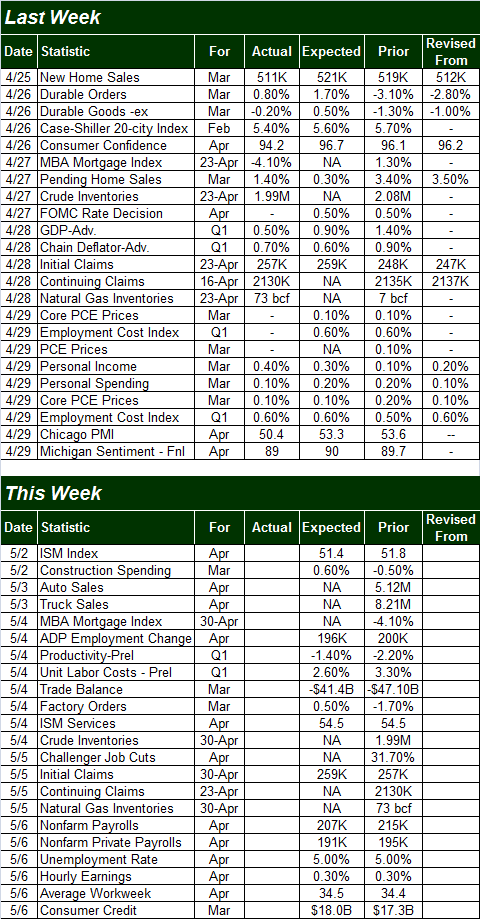
Source: Briefing.com
This week is going to be just as busy right from the onset, though there's little doubt all eyes are already looking to Friday's employment report for April. Economists are expecting the unemployment rate to hold steady at 5.0%, with nonfarm payroll growth expected to fall a bit to a pace of 191,000 jobs. It's yet to be eye-popping, but job-growth has been persistently decent for a long while now. This is providing a slow, smoldering upside for stocks and the economy. It's not strong enough to single-handedly save either though.
Job Growth, Unemployment Rate Chart
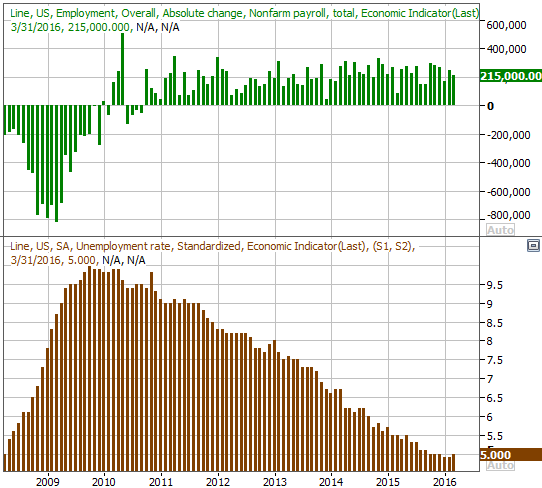
Source: Thomson Reuters
Note we may be at or near peak (well, trough) unemployment.
This week will also dish out last month's ISM numbers... manufacturing and non-manufacturing. Both were in a bit of a freefall, but we're seeing a glimmer of hope now. Another "up" month from both indices would do the market a lot of good.
ISM Index Chart
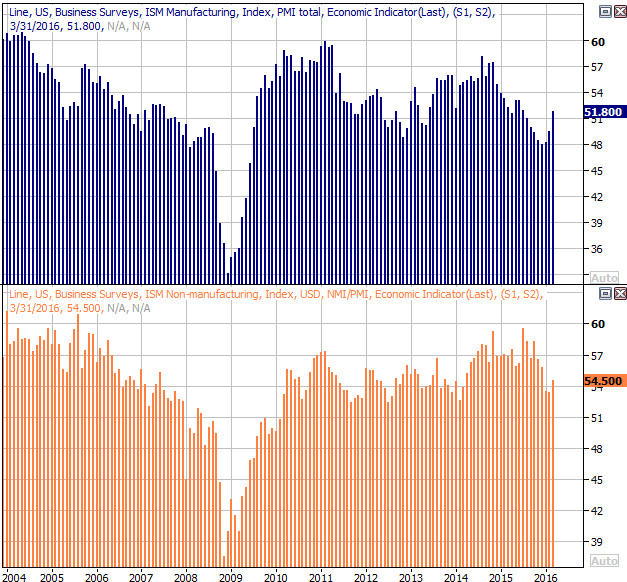
Source: Thomson Reuters
Stock Market Index Analysis
Stocks aren't completely over the edge of the cliff yet, but they're awfully close. One or two more bad days from here could inflict enough technical damage to incite a sizeable selloff.
The daily chart of the Nasdaq Composite (COMP) best illustrates this idea, so let's start there this week. On Thursday it broke below the 200-day moving average line (green) at 4846, and on Friday it continue lower to close just a tad below the 50-day moving average line (purple) at 4784. It's the biggest bearish move we've seen since February. We're now down 3.9% from the mid-April peak.
Nasdaq Composite & VXN Daily Chart
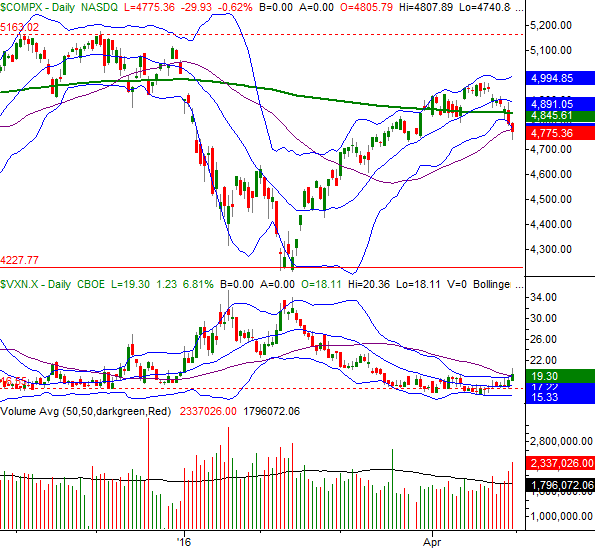
Chart created with TradeStation
The Nasdaq Volatility Index (VXN) is also perking up... much more so than we've seen in several weeks. It's not yet decidedly above a key technical ceiling around 19.0, but it's getting close, and bearing into it.
Perhaps the biggest red flag evident on the daily chart of the Nasdaq Composite is the fact that the selling volume is growing, and is already above the recent average volume. If this many sellers are already crawling out of the woodwork, how many more will do so when and if the index finally moves past the point of no return.
In retrospect, the rollover that started to take shape last week isn't terribly surprising. The timing and the location of this new-found weakness jibes with the market's action sense July of last year.
Nasdaq Composite & VXN Weekly Chart
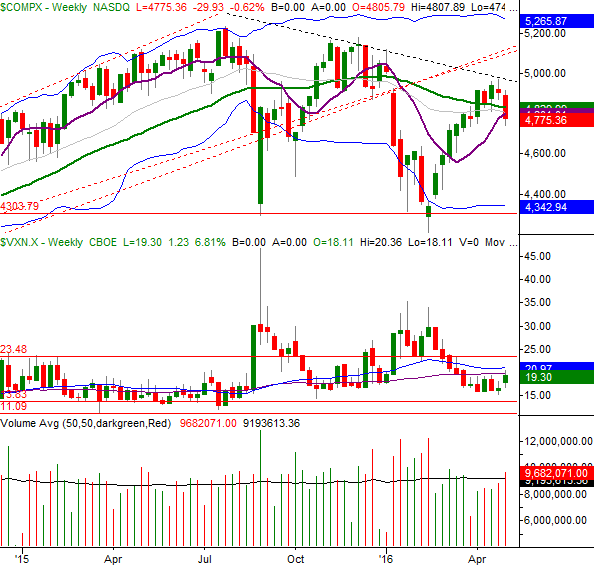
Chart created with TradeStation
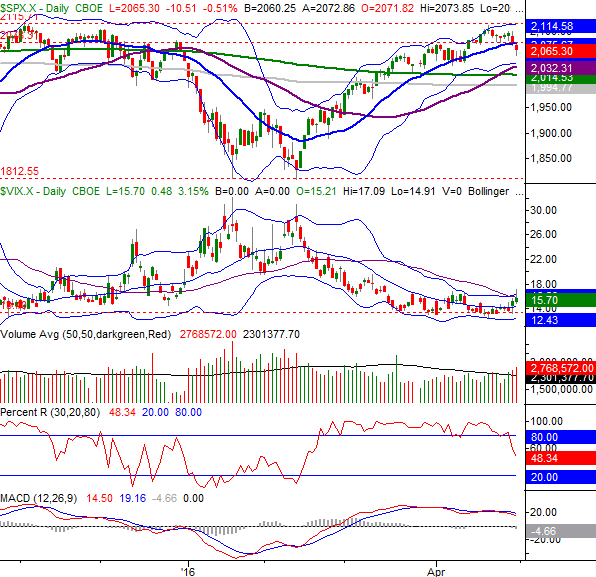
The daily chart of the S&P 500 tells the same basic story, though in a slightly different way.
Like the Nasdaq, the S&P 500 finally broke under a key support level late last week... the 20-day moving average line (blue) at 2076. The real floor to watch here, however, as the zone if support between 1995 and 2033. The CBOE Volatility Index (VIX) (VXX) is also testing the waters of a move above a key resistance line around 16.0. A little more "up" from the VIX and a little more "down" from the S&P 500 could do some real technical damage.
S&P 500 & VIX Daily Chart
Chart created with TradeStation
Underscoring the damage already inflicted on the S&P 500 is a Percent R line that's decidedly fallen back below the 80 threshold, and MACD lines that have been more bearish than bullish since early April.
The market isn't yet beyond hope; there's no overwhelming bearish momentum to speak of yet. As of Friday, the BigTrends TrendScore for stocks still stands in positive territory, at a score of 66.3 (out of 100.0). There's just not much bullish momentum left. This week could make or break stocks for the next few weeks. Just watch for the aforementioned floors to be broken as an early warning of such a pullback.
Market Volume Turning Bearish
A couple times last month, at the site, we posted charts and commentary pointing out that the market's underlying volume trend was a net-bullish one, supportive of the rally that began in mid-February. As long as that remained the case, the trend itself would benefit from a bigger bullish undertow even if it stumbled now and then. As of last week, though, we may want to keep an open mind about a reversal of that bullish undertow.
The chart of the S&P 500 below illustrates the concern. In the middle portion of the chart, a comparison of the NYSE's "Up" volume trend and the "Down" volume trend makes it clear we're moving towards a net-bearish volume environment, which would be indicated by a cross of the two trend lines (red, bearish above blue, bullish). We saw such a cross at the end of March, and that one didn't lead to a meaningful pullback. They're red flags all the same though. [Note the direction of each trend can be telling in and of itself.]
On the bottom portion of the chart, the Chaikin line -- a volume-weighted momentum line -- has also been falling since late March, telling us the rally ran out of bullish volume around then even though the market continued to coast higher a few more days. If the Chaikin line break below the zero level, that tend to mark the beginning of a serious wave of weakness.
S&P 500, NYSE Up/Down Volume Trend and Chaikin Line Chart
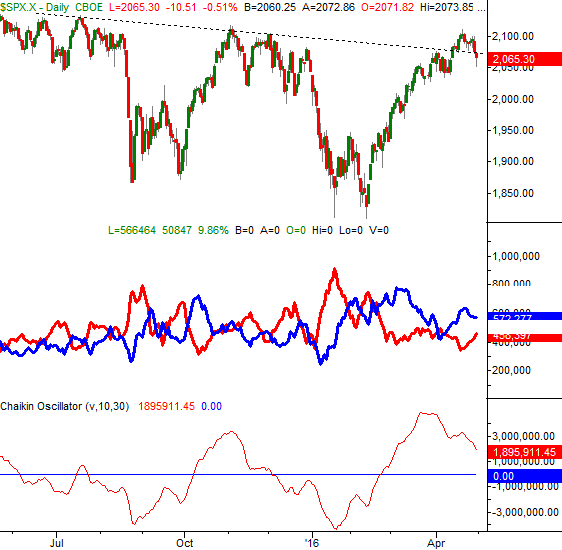
Chart created with TradeStation
We'll post an updated version of this chart if and when it becomes necessary.
Disclosure: None.


