
Weekly Market Outlook - Fed Wednesday Looms - September 19, 2016
Weekly Market Outlook - September 19, 2016
As much as the bulls tried last week, they could never get the market back above a key hurdle. The threat of a September rate hike just continued to circulate, and never gave the buyers a chance to get traction. Then again, the bears didn't make any progress either. They had several opportunities to deal a short-term death blow to the market, but could never get the job done.
With the a key rate hike decision looming on Wednesday, odds are good traders aren't going to make any major push before then. After that is a different story. There's no clarity as to which direction that may be, but the good news is, the make-or-break lines -- bullish as well as bearish -- are crystal clear.
We'll look at the matter from both angles after a quick run-down of last week's and this week's economic news.
Economic Data
Last week was loaded with economic reports, though collectively, they paint a confused picture leading up to this week's Federal Reserve meeting and interest rate decision.
The big influence on the FOMC at this time is inflation -- the committee wants to keep it tame without blowing out the economy's pilot light. Trouble is, it's not clear how much inflation we're facing. Producer prices remain relatively tame (and rose less than expected in August), while consumer prices were firm, and jumped more than expected. Either way, all the annualized inflation numbers continue to rise.
Annualized Inflation Chart
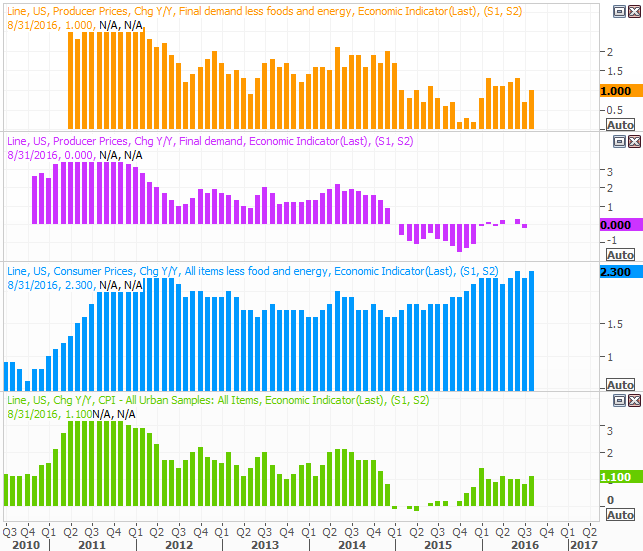
Source: Thomson Reuters
If the deciding factor for Janet Yellen is retail sales, she's likely leaning toward NOT raising interest rates this month. Last month, retail spending fell 0.3% counting cars, and fell 0.1% when taking automobiles out of the equation.
Retail Sales Chart
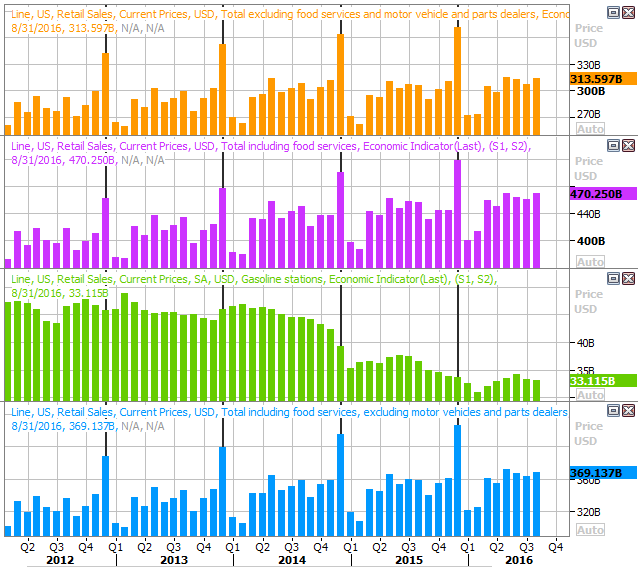
Source: Thomson Reuters
On the other hand, last month's consumer spending was considerably greater than spending seen in August of 2015. The year-over-year growth rates -- arguably a more meaningful comparison -- continue to taper off, but growth is still growth.
Finally, last month's industrial activity and capacity utilization tapered off a bit as well, right when it looked like both were ready to heat up. We're not in dire straits yet, but the market needs some help on this front.
Capacity Utilization and Industrial Productivity Chart
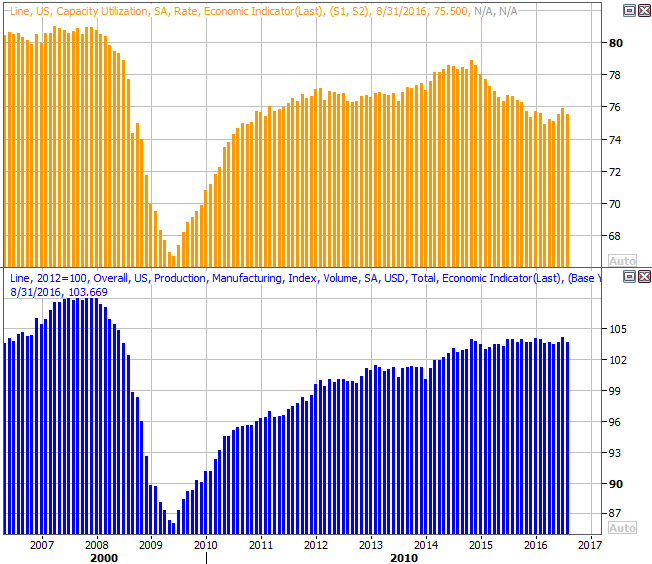
Source: Thomson Reuters
Everything else is on the following grid:
Economic Calendar
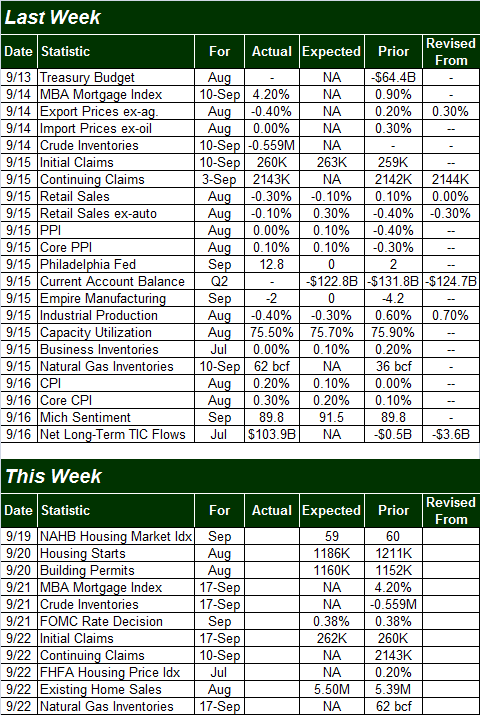
Source: Briefing.com
This week is going to be less busy, allowing even more focus to be put on Wednesday's interest rate decision. It's going to be a huge week for real estate news though. We'll get August's housing starts and building permits report on Tuesday, and we'll be getting existing home sales news on Thursday.
Starts and permits are expected to fall a bit.
Housing Starts and Building Permits Chart
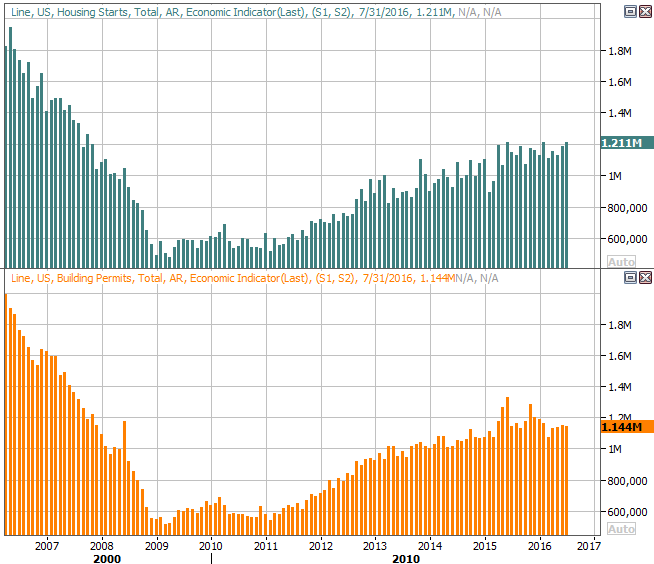
Source: Thomson Reuters
Existing home sales are expected to rise, just a bit. We've mentioned before one of the things possibly holding back sales of existing homes is minimal inventory. Still, there's broad progress here.
New & Existing Home Sales, Inventory Chart
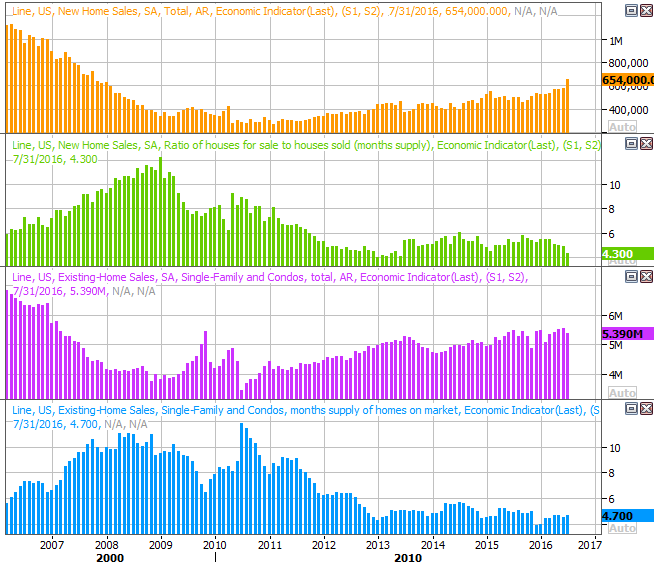
Source: Thomson Reuters
The existing home sales report will be rounded out by next week's new-home sales reports. Again, inventory is unusually low. Sales of homes continue to rise though, with new and existing sales slumps largely being offset by one another in any given month.
Stock Market Index Analysis
Talk about a mixed message. After moving to the brink of a collapse, the bulls managed to walk back from the edge of the cliff on Thursday when it looked as if the Fed had room and reason to hold off on a rate hike.
Then again, don't take Friday's failure from the market to pull back on the heels of the consumer inflation surge as a sign that all is well. Friday was a quadruple-witching day, where a whole slew of options all expire on the same day. It can -- and does -- impact how much or how little the market moves. In fact, it can impact the whole week's action, increasingly so as the week wears on.
That's why we have to take everything we saw last week with a grain of salt. That is to say, while the near-term situation looks more bullish than bearish, it may be something of an artificial bullishness.
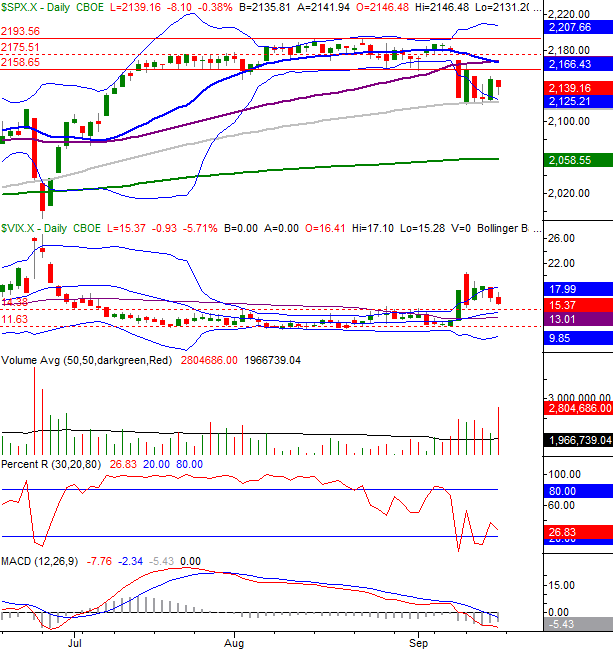
The good news is, there's little doubt as to where the bulls and the bears have drawn a line in the sand. A break above resistance or below support could finally yank the market out of this rut.
For the S&P 500 (SPX) (SPY), that floor is at 2123, where the 100-day moving average line (gray) and the lower Bollinger band are about to converge. The ceiling is at 2166, where the 20-day and 50-day moving average lines have converged (though there's a swath of resistance all between 2018 and 2193). The S&P 500 may have pushed up and off that support last week, but it didn't clear its key technical hurdles.
S&P 500 & VIX Daily Chart
Chart created with TradeStation
Indeed, as well as the S&P 500 held up last week, we're still closer to a technical breakdown than a breakout. The Percent R line could still easily fall back below the 20 threshold. If that happens and THEN the S&P 500 hits a lower low, that's a strong sign that the selling has taken on a life of its own. If that were to happen, the S&P 500 index would already be below its key 100-day moving average line.
The daily chart of the Nasdaq Composite (COMP) looks a bit more bullish. That is, the composite is back above its 20-day moving average line at 5226, and within sight of a key ceiling at 5274.... and moving in that direction.
Nasdaq Composite & VXN Daily Chart
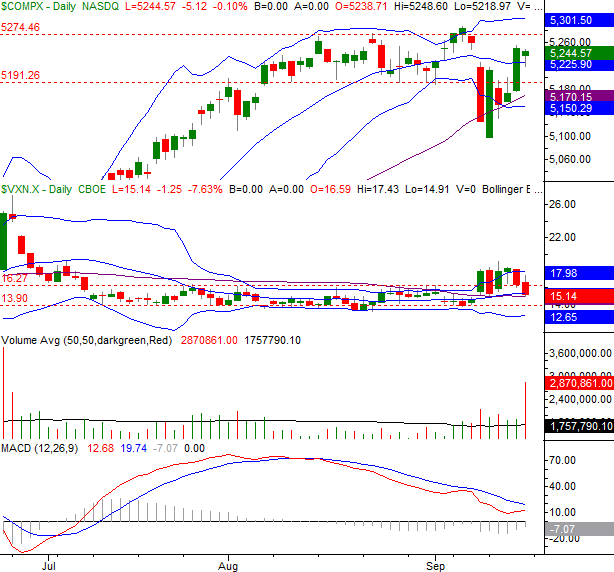
Chart created with TradeStation
Zooming out to a weekly chart we can see things from a different perspective. Here we can see how overbought the market still is, and how ripe for a pullback it is. Even with Thursday's and Friday's strength, the S&P 500 still closed near the low end of last week's range, and struggled to log the small gain it did. There's a lot more room to fall than there is to rise.
S&P 500 & VIX Weekly Chart
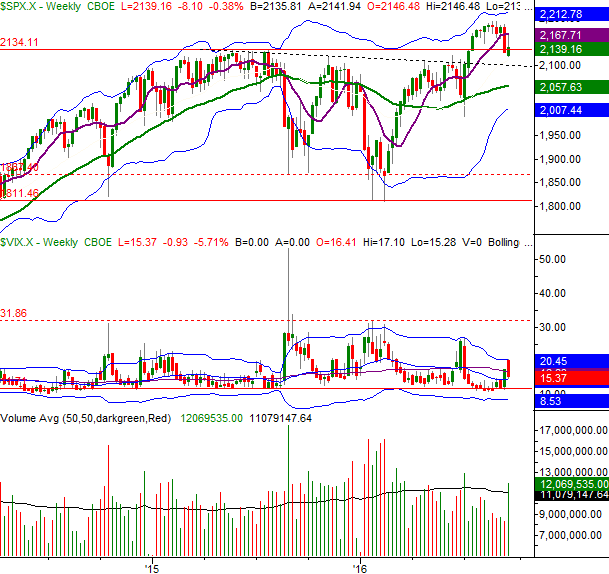
Chart created with TradeStation
Still on the fence, odds are good traders will simply coast until Wednesday's interest rate decision. After that decision is made, look for the bulls or the bears to finally make their move. Their commitment will be indicated by moves beyond the aforementioned levels. And, after stagnating for couple months now, the market could make up for lost time with a sizeable move.
Disclosure: None.


Thanks for sharing