
Watch The T-Bill/10yr Spread…
“Davidson” submits:
Most investors believe that ‘The Market’ knows more then they do. How high can the market rise if so many believe this about markets?
Every market cycle proves confusing to most investors. Prices rarely make sense from historical valuation metrics and new events and reports typically impact prices unexpectedly. Out of view, computers execute algorithmic complex investment strategies that can swing from buy to sell and back again within hours. Yet, the common belief is that investment markets reflect all knowledge public and non-pubic efficiently. If the trend is rising, the belief and most of the advice is to “Buy!” while a declining trend produces the opposite advice. With such belief, it is no wonder that market cycles swing to peaks of excessive valuation only to follow with its opposite, a corrective plunge to excessive under-valuation. With so many being trend followers, how high equity markets can go during any cycle is impossible to predict, but one thing one can count on is that, should we have a long string of good earnings quarters, it will be come with a higher than average historical valuation.
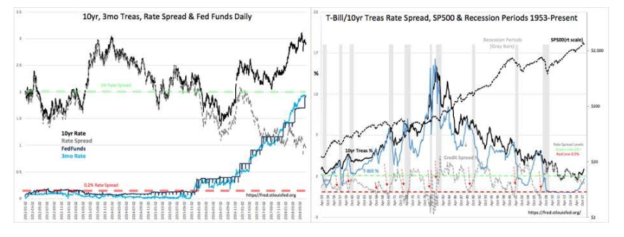
The T-Bill/10yr Treasury Rate Spread cannot tell us how high, but it does signal when a peak is ahead.
The T-Bill/10yr Treasury Rate Spread sits at ~1% or half-way between the historical range 0.2%-2% for this indicator since 1953. Even though this spread is important for the pace of lending and impacts the economic cycle, it can be used as a proxy for investor psychology in my experience. The current level of investor psychology can be called average vs. its history since 1953. John Templeton is famous not only for his investment record but for this quote:
“Bull markets are born on pessimism, grown on skepticism, mature on optimism, and die on euphoria,” he said. “The time of maximum pessimism is the best time to buy, and the time of maximum optimism is the best time to sell.”
The T-Bill/10yr Treasury Rate Spread has a long history of capturing investor psychology.
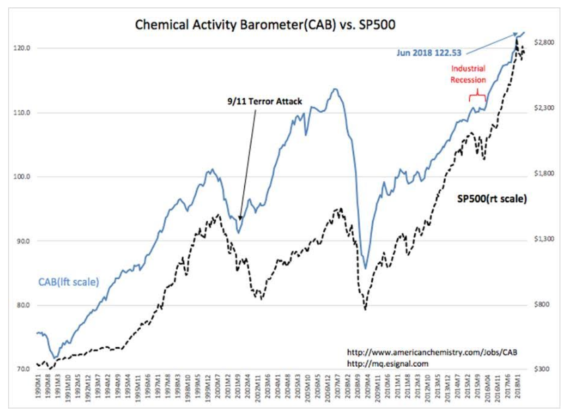
The Fed has an equally long history of raising or lowering Fed Funds after shifts in T-Bill rates which are market psychology driven. That conditions remain very positive for economic expansion was just highlighted by the Chemical Activity Barometer(CAB) reaching a new record high, 122.53. The CAB captures a broad array of chemical production activities which improve every aspect of our standard of living through lower costs and improved value. The correlation with the SP500 is pronounced. The CAB leads by 12mos-18mos.
The Investment Thesis:
Market prices have never given way to precise prediction. Prices are whatever people think they should be as they assess company specific information within the expected economic context combined with perceptions of the future. Market history is strongly correlated to the T-Bill/10yr Treasury Rate Spread, even though every market/economic cycle has unique and unpredictable characteristics. At the moment, conditions are very positive for higher equity prices/lower fixed income prices(higher rates). US policy changes if successful in lowering tariffs and reducing the threats to global Democratic institutions from Russia, Iran and No Korea, could extend the current economic cycle 5yrs. Having a series of earnings surprises extending for this length of time has always produced excessively high equity prices due to ‘The Recency Effect’. The future looks good, but remains unpredictable. The T-Bill/10yr Treasury Rate Spread identifies when the equity market peak is at hand and provides adequate warning of a correction. Not today!!
Disclosure: The information in this blog post represents my own opinions and does not contain a recommendation for any particular security or investment. I or my affiliates may hold positions or ...
more

