
VOO-Doo
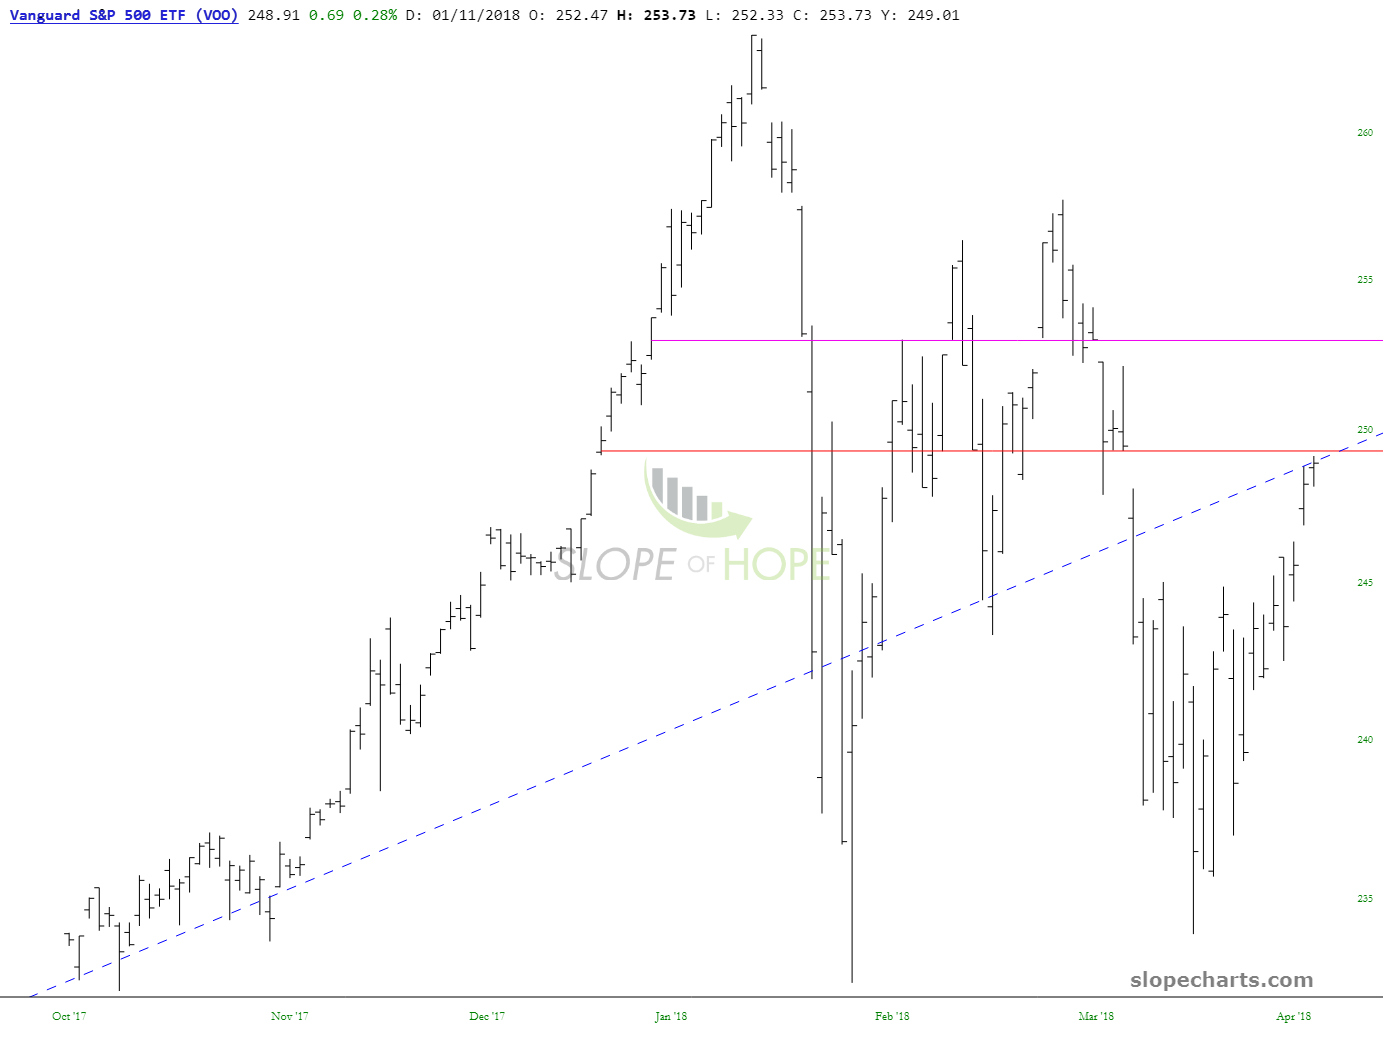
I am kind of fascinated by this VOO chart, which is based on the S&P 500. Check out the red horizontal as well as that dotted trendline. Notice how prices are mashed just beneath them.
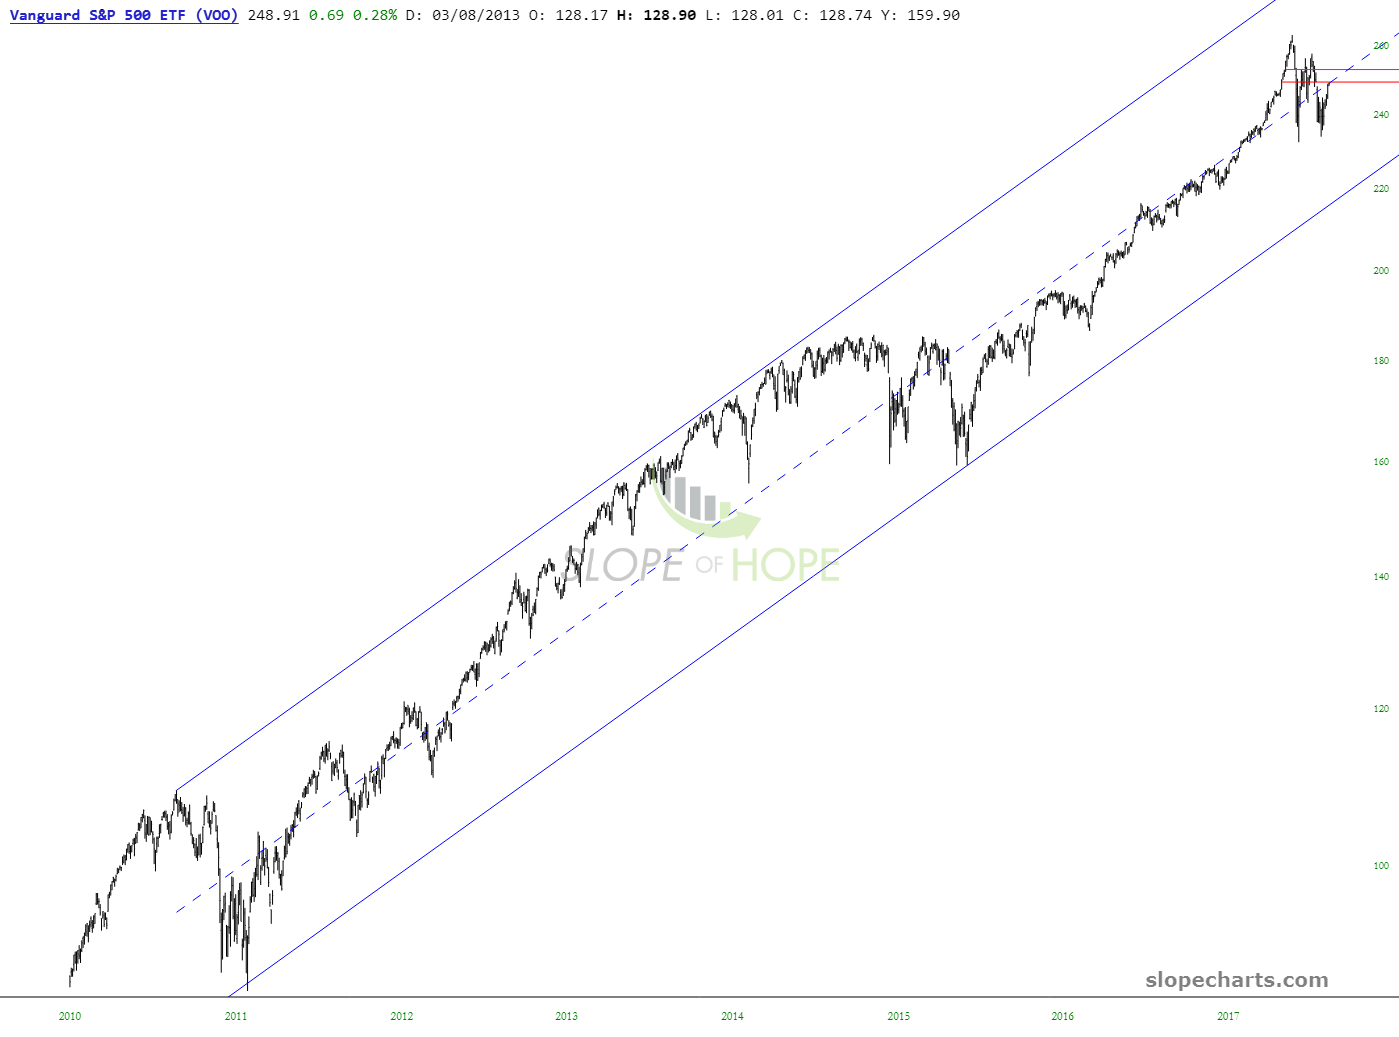
Taking a big step back, you can see the dotted line is simply the midline of the channel I’ve drawn, which goes back about a decade. I would say that’s an important level of long-term resistance.
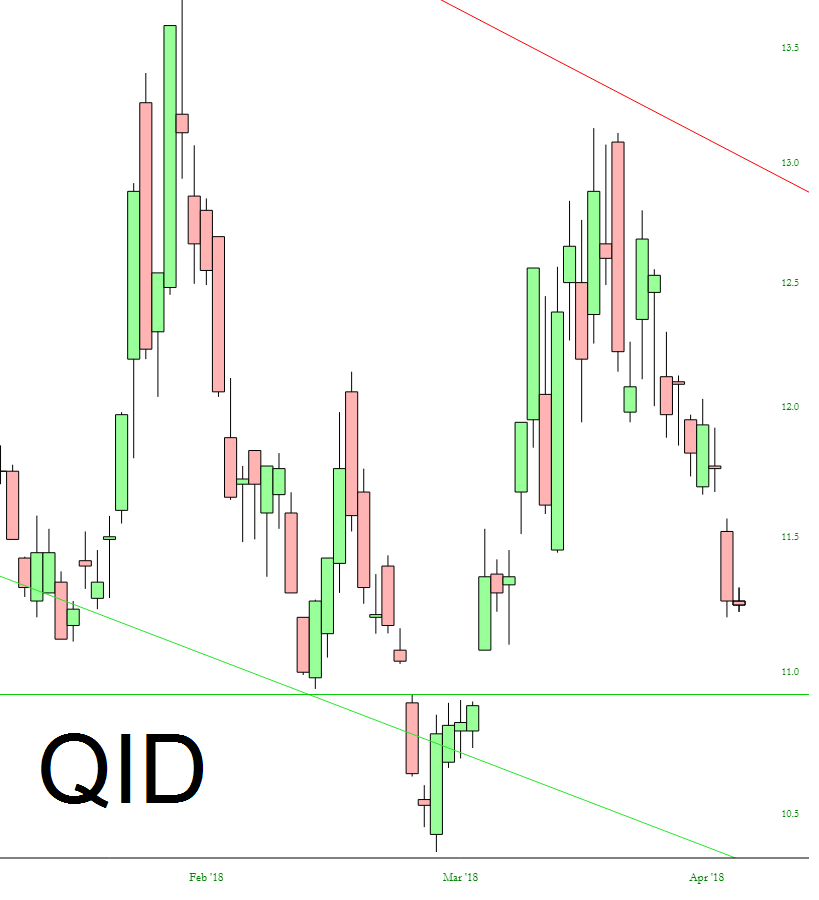
On a slightly related note, below is QID, the double-inverse-on Nasdaq instrument. I simply want to point out that green horizontal, which constitutes the price limit for the island reversal pattern (the value is 10.92). I am not going anywhere near this creature, but I simply want to point out that if we hold above 10.92, this could be a very interesting reversal higher.
Disclaimer: This is not meant to be a recommendation to buy or to sell securities nor an offer to buy or sell securities. Before selling or buying any stock or other investment you should consult ...
more

