
Volatility Is Back
IF IT WORKED IN 2017, ITS NOT WORKING NOW
The most profitable trades of 2017 are suddenly not working. Managers who made a killing selling volatility over the past five years woke up to the harsh reality that no strategy works forever, and that selling volatility in a late-cycle economy can be a recipe for disaster. The carnage was most evident in the sudden closing of an exchange-traded note, XIV, after losing almost 100% of its value overnight. But make no mistake, it was not only retail that got hurt during the February volatility spike -- there are a plethora of hedge fund managers licking their wounds. When a single day of market action can wipe out years of collected premium, you know you are in a crowded trade. Remember, being “short” anything exposes investors to unlimited risk, and those that believe they can trade out of a losing investment, often overestimate the liquidity that exists when investors rush for the exits. Case in point – XIV collapsed 80% after hours on light volume.
Meanwhile, technology bell-weathers, the so-called FANG stocks are losing their leadership. Market pundits are quick to blame security issues at Facebook and potential governmental regulation for the likes of Amazon and Google for the most recent weakness. But these are only catalysts for the sell-off. All of these bell-weather tech names are overly-crowded – a function of unprecedented liquidity and the passive investing movement that has continually funneled money to the largest and most prodigious stocks. Headlines don’t matter in a bull market, as “all news is good news.” When stocks finally react to negative headlines, it is usually because of crowded positioning. Simply put, there is just nobody left to buy.
Tesla, another stock with a cult-following erased its 2017 gains in a matter of weeks. Mr. Market has finally realized that any company with CCC-rated debt, an unprecedented cash burn, and negative earnings since it’s IPO, probably should not have a $50 Billion market-cap. Again, if it worked in 2017, it’s not working now
In our 2017 third-quarter newsletter, we wrote, “We have long been proponents of the theory that the principal risk to equity markets is an uptick in yields--one that would nullify the last supportive valuation metric. The implication of this prognosis is paramount to client allocations because it implies that a bond sell-off not only accompanies an equity sell-off but that it causes it. The ever-important negative correlation between bonds and equities in times of heightened volatility—that managers depend upon--will cease to exist.” Investors who were leaning on their bond allocations to cushion an equity sell-off will be quite disappointed when they look at their Q1 statements. Quarterly returns for bond indices did little to support tech-heavy equity portfolios.

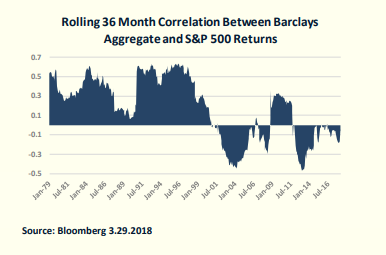
The chart below illustrates how spoiled investment managers have been over the last 17 years. The negative correlation that has existed between the monthly returns of the Barclays Aggregate and the S&P 500 is gone, and it may turn positive (as it was for the twenty years prior to 2000). In such an environment, managers will have to get a bit more creative as Sharpe Ratio’s plummet. The 60-40 portfolio of stocks and bonds may not provide the risk-adjusted returns to which investors have become accustomed. So-called “risk-parity” funds will also need to change many of their volatility assumptions and asset class weightings.
FINANCIAL CONDITIONS TIGHTEN, BUT NOT TOO MUCH
The Federal Reserve is raising rates and executing its Quantitative Tapering program. As a result, there is palpable concern that financial conditions are going to tighten. But as the chart below illustrates, financial conditions are still very loose.
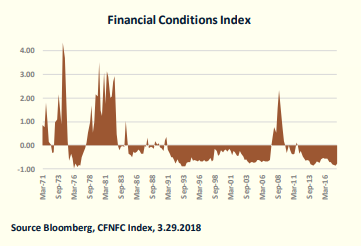
The uptick in the first quarter, when viewed in a longer-term historical context, is merely a blip. The last two recessions were preceded by financial condition readings much closer to (or above) zero. Although we are in the late stages of this expansion, financial conditions are not yet flashing red.
Two indicators that deserve a mention are the Libor-OIS spread and the yield curve. The former is the spread between the rate at which banks lend unsecured funds to each other on a three-month basis, and the overnight indexed swap rate (which does not include credit risk because no notional principle is exchanged). Recently, this spread had increased to almost 60 basis points, the highest since the Great Recession. Many suggest that this spike is indicative of an unwillingness to lend, and general distrust among banks. While I agree that this data series should be monitored, I think there are a few less pernicious causes for the spike. First, increased T-Bill issuance tends to crowd-out interbank lending, as shown in the chart below.
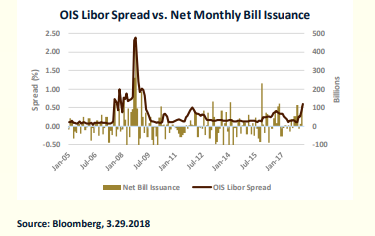
And secondly, the dollar funding market is adapting to the one-time shock of repatriation. It is likely that due to the recent tax overhaul, $2 Trillion of overseas earnings will be repatriated, much of it from the banking sector. This is adversely affecting the dollar lending market overseas. As a result, the Libor-OIS spread is spiking not because banks mistrust each other, but rather because they simply don’t have the money to lend. A lower supply of dollars overseas is driving USD funding costs higher. Robust T-Bill issuance and continued repatriation are likely to drive these funding costs higher in the near-term, and pundits will cite this as a reason why markets across the board should go lower. But again, unless dollar funding moves higher because of interbank mistrust, I see no reason to view this as an insidious omen.
We also continue to see yield curve flattening as the Fed moves short-term rates higher, and longer-term rates remain stubbornly low, relatively speaking. The spread between the ten-year and the two-year Treasury recently tightened to under 50 basis points.
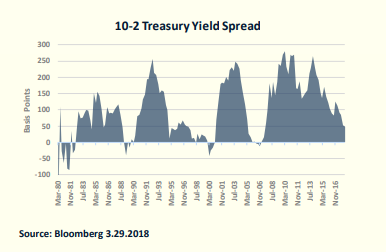
Inversions have historically been great predictors of Recession, which typically follow 6 to 18 months postInversion. We don’t expect to see an inversion in 2018. In fact, after the speculative short position in Bonds is cured, we expect steepening from current levels due to a weak dollar and increasing inflation and wages. The Fed is certainly taking notice of the flattening yield curve as recent comments from members indicated that they could slow their hiking program. As we have cited before, they could also sell the longer-dated Treasuries on their balance sheet to buy time for more rate hikes, if macro-data continues to merit it. In any case, we expect one more steepening move before ultimately inverting and going into recession. THE TECH WRECK WILL
IGNITE SECTOR ROTATION
Leadership in this late cycle expansion will likely change and the most recent weakness in technology could be the catalyst. Commodities and energy typically benefit from an overheating economy and an inflationary environment. And while many of the strategies that were profitable in 2017 are no longer working, we expect energy and commodities, which had a terrible 2017, to gain leadership. Commodities have been underperforming the broad market for more than a decade as illustrated below.
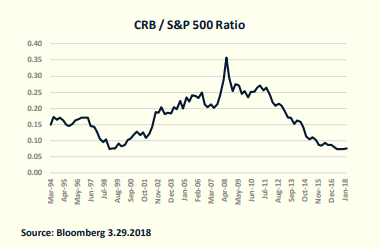
Given the long-term underperformance, and the likelihood that we are entering the stage of the economic cycle that is typically beneficial for commodity names now may be a good time for sector rotation.
HIGH YIELD IS AN INTEREST RATE PLAY – BE WARY, WE ARE LATE CYCLE
The recent weakness in high yield is being cited by many as a harbinger of economic turmoil. However, the sell-off is more a function of rising interest rates, than it is of deteriorating credit quality. Below is a chart showing the one-year price of a 5-year treasury and HYG. As you can see, they have been moving in tandem, and spreads, although they have widened a bit, have been relatively stable.
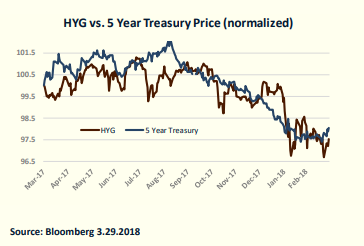
While the recent sell-off in high yield isn’t indicating anything other than higher treasury rates, there is still little value in the High Yield sector. With spreads at multi-decade lows, the asset class is not only abundant with credit risk but as illustrated, it also has rate risk. For these reasons, we think it is prudent to be extra-selective and underweight high yield.
BDC LEVERAGE RULES RELAXED
One of the subsectors in fixed income that we think has a strong risk-reward profile is the debt of Business Development Companies. Many of the issues are investment grade, senior unsecured, have five-year maturities, and yield between 5 and 7 percent. The recent spending budget signed by Trump changed the asset coverage ratio requirement for these issuers from 200% to 150%. While we are not overly exuberant for these issuers to become more leveraged, we still like the space. BDC’s exist to pay dividends to shareholders, and if they trip their asset coverage ratios they are forced to buy back debt and/or eliminate dividends in order to come back into compliance with their regulatory requirements. It is not only the margin of balance sheet safety that gives us confidence in BDC baby bonds, it is the requirement to buy back debt and the threat of having to cut dividends that reassure us. We have not seen any adverse price reactions in these bonds post-legislation. And in many cases, we think the increased leverage will enable these companies to act as more prudent underwriters to the middle market and strengthen the asset side of their balance sheets.
Disclosure: This article is distributed for informational purposes only and should not be considered investment advice or a recommendation of any particular security, strategy or investment product. ...
more

