
Volatility: A Step Back From The Brink
It’s still touch and go with risk warnings according to stock market volatility, but the threat pulled back from extreme levels yesterday. The VIX (a measure of the implied volatility of S&P 500), for instance, dipped below 20 for the first time since October 9. A day or two of slightly lower vol after the recent surge in risk could easily turn out to be noise and so it’s not yet obvious that the roller coaster ride is over. But for the moment, the decline inspires a bit of optimism that the market may be headed for calmer waters.
In any case, let’s put the latest decline into perspective by reviewing several measures of stock-market volatility (see definitions below) with a statistical technique that puts the numbers on an equal footing for easy comparison: percentile rank. Let’s start with a rolling 3-year window, as shown in the chart below. By that yardstick, five benchmarks of risk have dipped below the 90th percentile. Another bout of anxiety could easily push vol above this critical level again, but as of yesterday (Oct. 20), Mr. Market’s anxiety profile looks a touch less threatening.

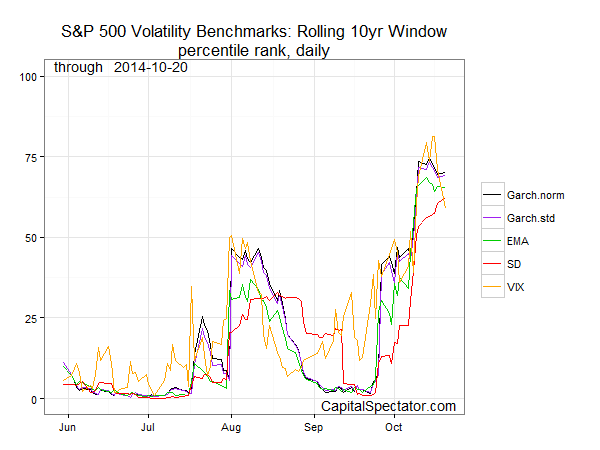
The recent calm is even more conspicuous when we consider volatility via a rolling 10-year widow. By this standard, risk is no higher than the 70th percentile.
The latest dip in vol may reveal itself to be a period of calm before the next phase of the storm. As such, the days ahead could be decisive for deciding if the worst has passed… or yet to come.
On the bright side, one risk factor still looks unthreatening: the US economy. As detailed in yesterday’s update on America’s economic profile, a growth bias continues to prevail. That alone doesn’t ensure smooth sailing in the stock market, but it’s certainly a stabilizing force. The question is whether US macro resiliency can offset the darker forces bubbling elsewhere in the world.
***
The percentile rank data is calculated in R with the runPercentRank function. The five measures of S&P 500 volatility cited above are defined as follows:
VIX: market expectation of near term volatility for S&P 500 based on index option prices.
EMA: 30-day exponential moving average of the S&P 500’s squared daily % return.
SD: 30-day standard deviation of the S&P 500’s daily % return
Garch.norm: a Garch(1,1) model that assumes a normal distribution via the rugarch package in R.
Garch.std: a Garch(1,1) model that assumes a “fat-tail” distribution based on a Student’s t-distribution via the rugarch package in R.
Disclosure: None.


