
VIX Challenged The 50-Day Moving Average
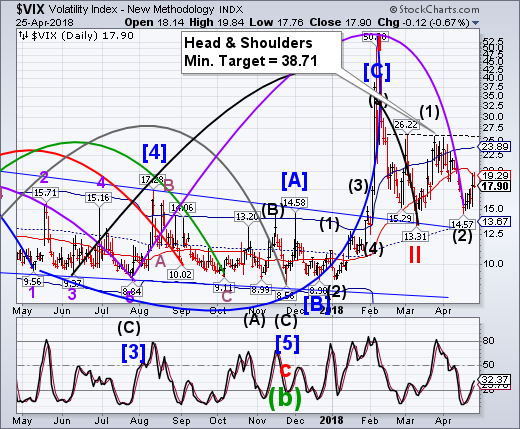
VIX challenged the 50-day Moving Average, currently at 19.29. A close above the 50-day confirms the buy signal for the VIX. It may have completed a right shoulder of an inverted Head & Shoulders formation as well, giving it a probable upside target. VIX ETFs have had the largest inflows in 5 years.
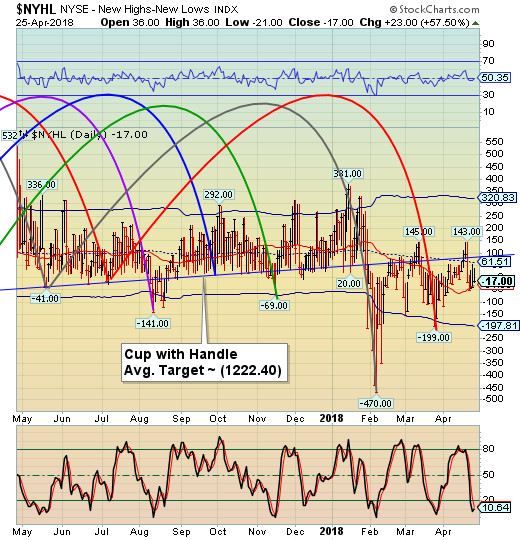
-- The NYSE Hi-Lo Index declined beneath its trendline near 80.00 and mid-Cycle support at 61.51 last Friday, putting it on a sell signal. The Cycles Model suggests the potential for a deeper low in early May.
(ZeroHedge) What traders refer to as the 'liquidity smile' formed by the pattern of trading volumes has recently become more pronounced and turned it into a 'liquidity smirk'...
As The FT's Robin Wigglesworth reports, a seismic shift towards exchange-traded funds and other index-tracking investment vehicles has heightened the importance of the last half-hour of the US trading day, from 3.30 to 4pm, when these passive funds typically conduct most of their activity to accurately match their benchmarks.
That has prompted traditional active managers to conduct more of their trading during this window to benefit from greater market “liquidity”.
Some traders and investors complain that the funneling of activity into the last half-hour of the day - which comprises nearly a quarter of all US stock trading - is sucking liquidity away from the middle of the day, when making large trades can now have a noticeable market impact.
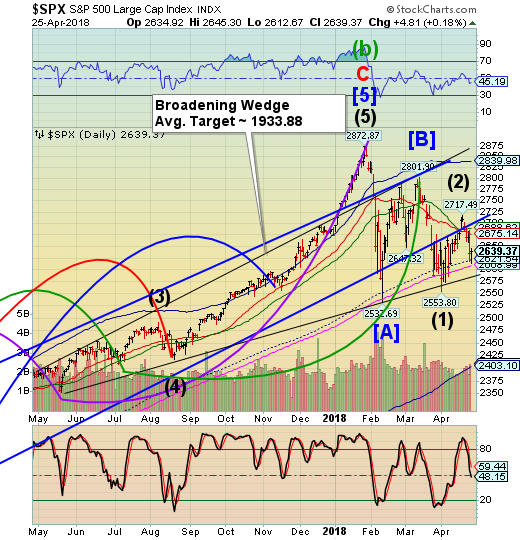
-- SPX declined very near to its 200-day Moving Average at 2608.99 today. This may not be the last test of this support. More importantly, the Broadening Wedge trendline lies just beneath the 200-day. A breakdown beneath that level offers a startling downside target.
(NewsTribune) A late round of buying erased early losses on Wall Street, leaving major indexes mixed at the close of trading. Bigger companies managed to eke out modest gains, while smaller companies mostly fell.
A big gain in Boeing pushed the Dow Jones industrial average higher, breaking a five-day losing streak. Late in the day, energy companies got a boost after Exxon Mobil said it is raising its quarterly dividend.
Stocks got off to a weak start as investors worried that growing costs for raw materials along with rising interest rates would hold back profit growth for U.S. companies. Defense contractors stumbled following first-quarter reports from Northrop Grumman and General Dynamics.
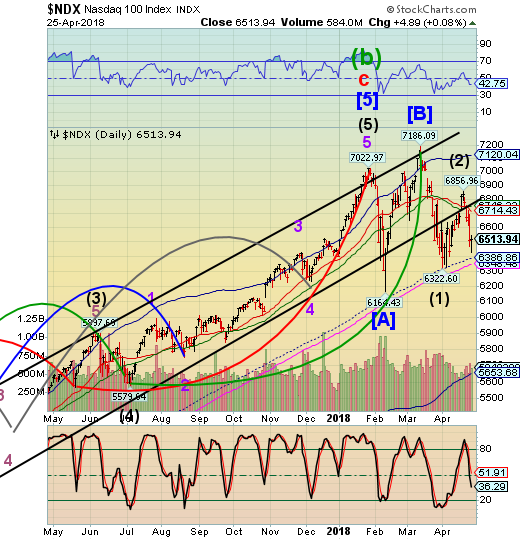
-- NDX declined back through the 2-year trendline, resuming a decline. It bounced above mid-Cycle support at 6386.86. A break of the mid-Cycle support and more importantly, the 200-day Moving Average raises the probability of a change in trend.
(CNBC) The New York Stock Exchange suspended trading on the floor for the rest of the session Wednesday in Amazon, Booking Holdings and Alphabet due to a "price scale code issue," according to the exchange's website. The stocks traded normally elsewhere, including on their home exchanges.
The exchange said "any open orders in these securities will be canceled" on its status page.
The issue affecting stocks with prices above $1,000 which trade primarily at the Nasdaq. Booking Holdings (formerly Priceline), Amazon and Alphabet are the three highest priced stocks in the S&P 500 and the only ones with prices that are four digits.
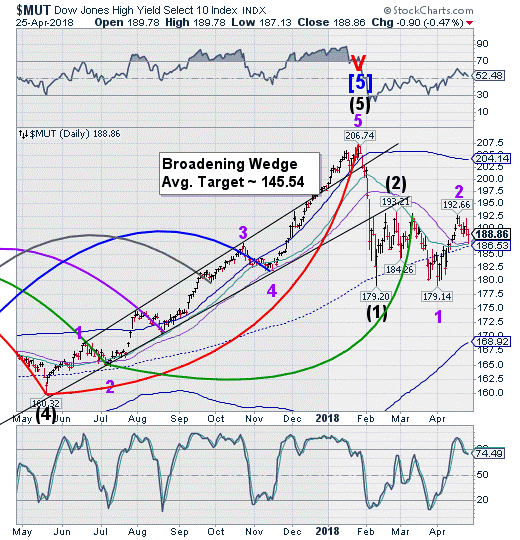
-- The High Yield Bond Index challenged the 50-day Moving Average at 187.36 today after making a lower high last week. Today was a Primary Cycle Pivot day which may accelerate the decline into the week of May 7.
(MarketWatch) A swift rise in bond yields in 2018 has sent fixed-income investors scrambling, with major categories of bond exchange-traded funds seeing steep outflows, while other groups have found favor.
While flows into bond products remain positive overall—extending a decadelong rotation into fixed-income from stocks—investors have retreated from notable categories, a sign they believe yields could continue rising, which would mean further deterioration in the funds, as prices and yields move inversely to each other.
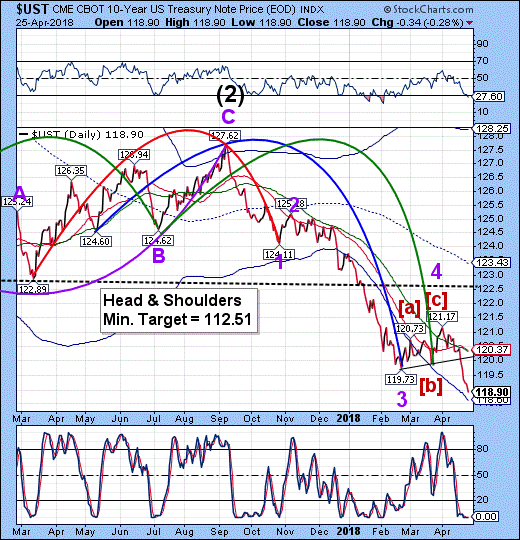
UST declined through the trendline, breaking to new lows not seen since April 2011.The commencement of the decline suggests we may see a waterfall decline lasting through early July.
- ZeroHedge) If yesterday's 2Y auction was ugly, with poor bidside demand, today's 5Y was at worst average.
Moments ago, the Treasury sold $35B in 5Y paper, the most for a single 5Y auction since Jan 2016, at a high yield of 2.837%, stopping through the When Issued 2.838% by 0.1bps and more than 20bps higher than the 2.612% yield in March. This was the highest yield since September 2008 and is where the 10Y yield was trading exactly one week ago.
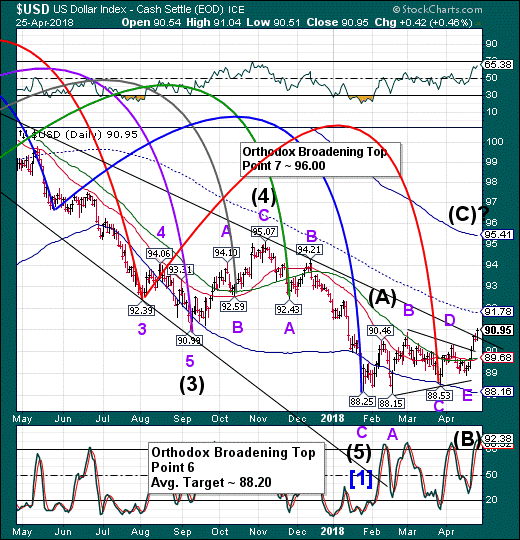
- The U.S. Dollar broke out of its Triangle formation and a declining Broadening Wedge formation to begin its bullish journey to the Cycle Top resistance at 95.41. Last week’s decline did not meet or break the lower Triangle trendline as suggested. In rare instances, a Wave E may fall short of touching the lower trendline before reversing. Dollar bears are starting to feel the pain.
(ZeroHedge) The Dollar Index broke above the key 90.00 level, up 5 days in a row -the biggest spike since Dec 2016 - to its highest level since mid-January. With net speculative positioning at extreme shorts, and liquidity stress (Libor-OIS), one wonders how far the short squeeze can go...
Breaking above its 100DMA for the first time in 2018...
And as we previously noted, the world and his pet rabbit is short the dollar...
For context, that is the biggest USD short in at least 3 years...
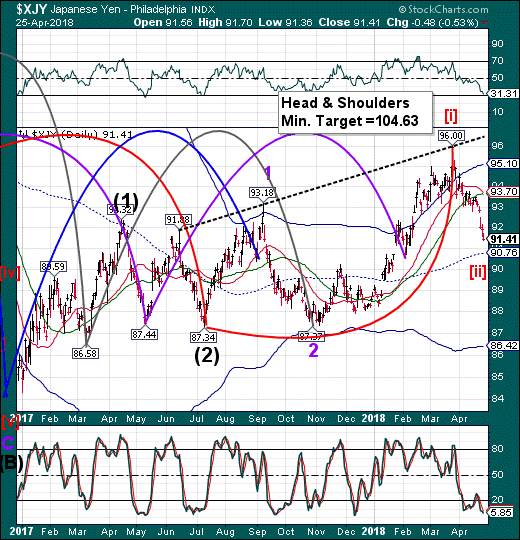
--The Yen appears to have extended its decline but may reverse course by this weekend. This opens the probability of a resumption of the uptrend through mid-May. A rally above the inverted Head & Shoulders neckline may give it the capability of reaching its stated target.
(CNBC) The Japanese yen is expected to weaken amid good global growth, said Standard Chartered Bank's head of global macro strategy and foreign exchange research.
He added that the country is unlikely to hit its inflation target of 2 percent by 2019.
"We don't expect much yen strength even in the context of a weaker dollar," Eric Robertsen told CNBC's "Capital Connection" on Monday.
"Growth is good — they are benefiting from good global growth, good regional growth. But there's a lack of inflation," he said, noting that Japan's inflation rate net of food and energy is below 1 percent.
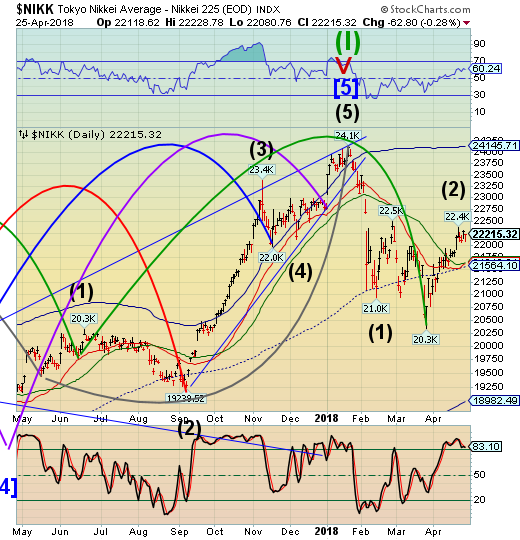
The Nikkei seems to be in a consolidation mode after completing an expanded/irregular correction and half Trading Cycle high. The Cycles Model suggests a Panic Cycle may begin that may not find a bottom until late May.
(EconomicTimes) Japanese stocks slipped on Wednesday as weakness on Wall Street soured risk sentiment, while the spotlight fell on Takeda Pharmaceutical which stumbled after it sweetened its takeover bid for Shire to 46 billion pounds ($64 billion).
The Nikkei ended 0.3 per cent lower to 22,215.32.
Takeda dived 7.0 per cent as investors fretted about its ability to finance the cash and stock deal.
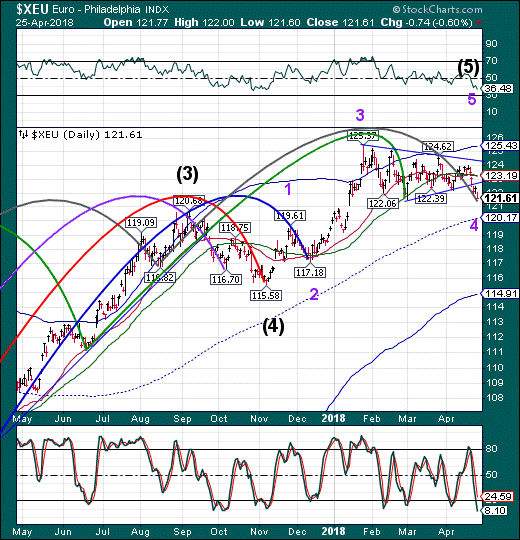
-- The Euro appears to be finishing an extended triangle formation by early next week. The Cycles Model calls for a Master Cycle pivot in early May, which may turn out to be quite dramatic. The minimum target may be above 126.00.
(Bloomberg) Rather than looking at what investors expect, perhaps the better question is: What does the European Central Bank want to achieve out of its April 26 meeting? Sticking the euro in a box is the answer.
Currency stability helps its cause as it manages the delicate balancing act of bringing its QE stimulus packages to a close sometime this year. The Governing Council’s coordinated message – that ending bond purchases doesn’t need to be rushed – has helped take the wind out of the euro's sails. What officials need to do now is focus on keeping it in the range it’s already set this year. That should buy it time to steer the decision-making process over the summer.
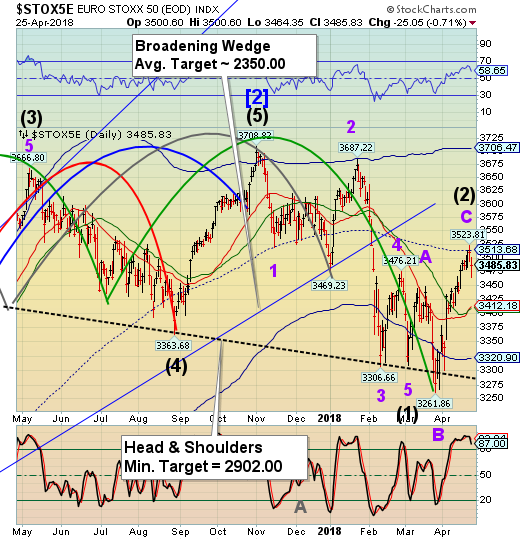
EuroStoxx 50 Index tested mid-Cycle resistance at 3513.68 Tuesday, then reversed down. European stocks may be sitting on the edge of a panic phase in its downtrend that may last through mid-May.
(CNBC) European stocks closed lower Wednesday, as rising yields in the bond markets offset excitement surrounding corporate earnings.
The pan-European Stoxx 600 closed provisionally down 0.77 percent, with most sectors and all major bourses in the red. Basic resources stocks were down almost 1.8 percent while industrials were almost 1.7 percent lower. Overall, market players were worried with the impact of higher interest rates on the stock market, and more broadly, on the global economy.
The U.S. 10-year Treasury yield topped 3 percent on Tuesday — the first time it has done in more than four years. Investors around the world have been fixated on the 10-year note, with concerns looming that hitting the 3 percent barrier could trigger a reaction from financial markets both in the U.S. and internationally.
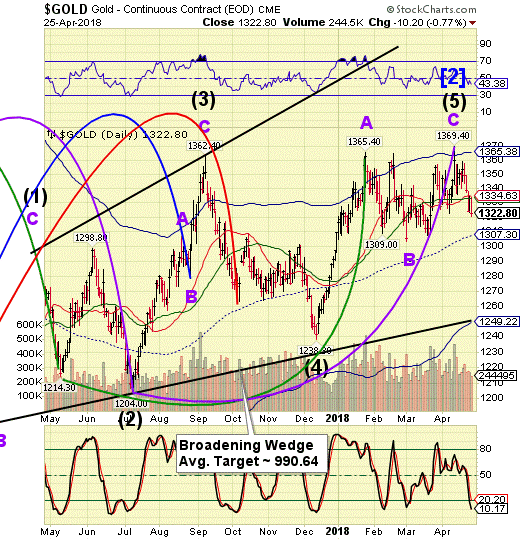
-- Gold slipped beneath the 50-day Moving Average at 1333.20 on Monday. After a failed retest on Tuesday, it resumed its decline. The Cycles Model suggests a significant decline over the next two weeks.
(Reuters) - Gold slumped to a five-week low on Wednesday as the dollar jumped and U.S. Treasury yields continued to rise on signs of U.S. economic strength and an easing in the U.S.-China trade conflict.
The benchmark U.S. 10-year Treasury yield breached 3 percent on Tuesday for the first time in more than four years and remained above that level on Wednesday as jitters about growing federal borrowing spurred selling of U.S. government bonds.
Higher yields on bonds make gold a less attractive investment because it pays no interest.
"On a technical level, people have been watching it for a long time. Yields have been trending lower for multiple decades really, so some have argued in the marketplace that we are right up on the cusp of a regime shift," said TD Securities commodities strategist Daniel Ghali.
Spot gold was down 0.66 percent at $1,321.56 per ounce by 1:56 p.m. EDT (1756 GMT). It touched a session low of $1,318.51, the lowest level since March 21.
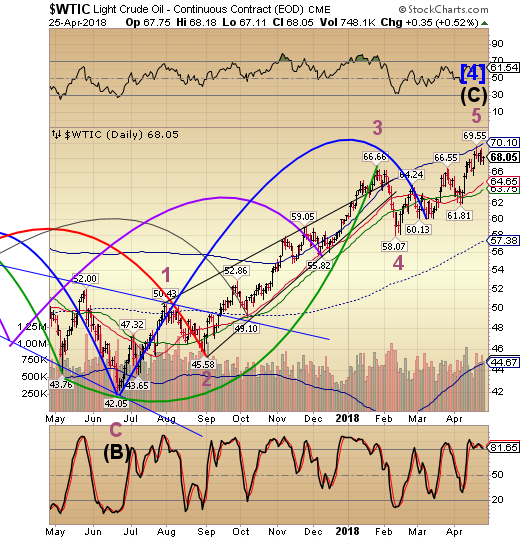
West Texas Intermediate Crude may have reached its 3.5-year high last Friday, according to the Cycles Model. Last week I observed, “There seems to be a strange relationship between Cycle tops and Options Expiration, which finishes on Friday.” The Cycles Model suggests the next significant Cycle low may occur in mid-May.
(OilPrice) After API surprised markets with a 1.1-million-barrel build in crude oil inventories yesterday, the EIA reinforced the mood by reporting a 2.2-million-barrel build for the week to April 20.
Analysts had expected a modest build of 290,000 barrels in the period.
The authority also said gasoline inventories had gone up by 800,000 barrels in the reporting period, compared with a 3-million-barrel decline a week earlier. Distillate inventories last week fell by 2.6 million barrels, from a drop of 3.1 million barrels reported for the prior week.
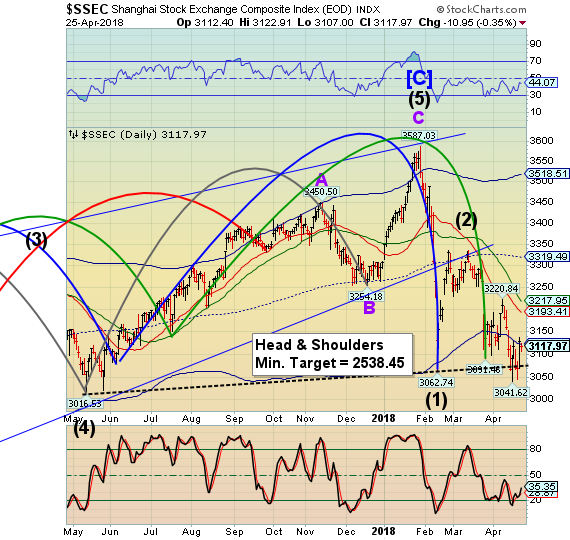
The Shanghai Index challenged the Head & Shoulders neckline but bounced back to retest the Cycle Bottom at 3120.47. Last Wednesday was a Trading Cycle (minor) low. The bounce may have already been spent before resuming the downtrend. The Cycles Model suggests a probable panic decline developing through early June.
(ZeroHedge) As concerns about nuclear war with North Korea wane, Taiwan is reminding the world that its own relations with Beijing have been progressively deteriorating; to do that the small island nation will simulate a response to an "invading force", along with using civilian operated drones, in war games next week amid its increasing tensions with China the defense ministry said Tuesday according to Reuters.
While the annual Han Kuang drills, set to begin on April 30 with a computer-aided command post exercise, make no mention of China, only “offensive forces invading Taiwan” and will include a live-fire field training exercise and “enemy elimination on beaches”, it is clear that the "hypothetical" aggressor is China.
The major part of the drill will be a live-fire field training exercise from June 4-8, including “enemy elimination on beaches”, the ministry said.
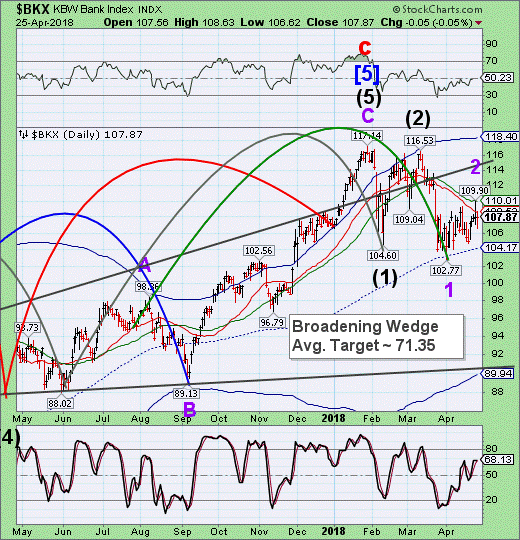
-- BKX retested the 50-day Moving Average at 110.10 on Tuesday before reversing beneath Intermediate-term support at 108.52. It is now on a sell signal. Gravity may take over the index again as weakness prevails through late May. Something’s going on here and no one has put his finger on it yet.
(ZeroHedge) Earlier today, we said that the primary driver behind Caterpillar's unexpectedly gloomy guidance cut and spectacular price drop, which dragged the Dow Jones as much as 600 points lower, was the ongoing decline in China's credit impulse, something we have been warning about for months.
A few hours later, one of the few remaining respected analysts, Jim Grant, writing in his Grant's Almost Daily daily wrap confirmed out observations, and also attributed CAT's rolling over retail sales as well as disappointing outlook on China's credit impulse.
Grant's full note is below.
Impulse control
Two debt-laden ships pass in the night. As rates in the U.S. mostly ride the escalator, Chinese government yields have enjoyed visible downward momentum in recent months. The 10-year Chinese government bond yield currently sits just under 3.58%, down from 3.9% on Dec. 31, 2017. The move at the short end has been even more pronounced. China’s one-year yield has dropped below 3%, down from more than 3.8% at the turn of 2018. More broadly, Bloomberg notes this morning that “Chinese bonds are the top performers so far this year, among 70 markets in the Bloomberg Barclays Global Aggregate + China index, calculated in dollars.”
(ZeroHedge) Having "killed" the Japanese bond market - the largest in the world - through never-ending meddling in market forces, it seems the impact of the world's central bankers' egos on basic market structure is becoming more and more widespread (and concerning).
As The Wall Street Journal recently noted, worsening liquidity comes as banks have reduced inventory of riskier assets and investors more closely track bond indexes, making it harder and harder to buy or sell when they want (let alone when they need)...
The liquidity problem has been worsening for years. Investors say it began nearly a decade ago, when post-financial-crisis regulation prevented banks from trading for themselves, and forced them to hold larger amounts of capital - thereby shrinking their inventory of riskier assets. This, in turn, reduced banks’ ability to serve as intermediaries between buyers and sellers.
(ZeroHedge) Just two weeks after John Cryan's ouster, Bloomberg reports that, according to people familiar with the matter, Deutsche Bank is considering extensive cuts to its cash equities business in the U.S..
It appears new CEO Christian Sewing is leaving no stone unturned as he continues the wider restructuring of the bank's investment banking division and this would be the first strategic decision under his tenure.
In a first memo to staff, Sewing took a tough line on the bank’s stubbornly-high costs and said the bank will pull back from areas where it’s “not sufficiently profitable.”
Until next week…
Disclaimer: Nothing in this article should be construed as a personal recommendation to buy, hold or sell short any security. The Practical Investor, LLC (TPI) may provide a status report of ...
more

