USD/JPY Rate Rebound Unravels Even As BoJ Sticks To Dovish Script
(Click on image to enlarge)
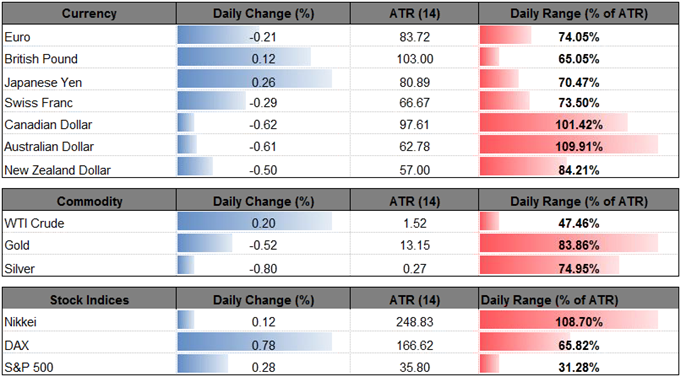
USD/JPY REBOUND UNRAVELS EVEN AS BANK OF JAPAN (BOJ) STICKS TO DOVISH SCRIPT
![]()
The near-term rebound in USD/JPY unravels even as Bank of Japan (BoJ) Governor Haruhiko Kurodacontinues to strike a dovish tone in front of lawmakers, and the pair appears to be on track to test the monthly-low (105.25) as it carves a fresh series of lower highs & lows.
The fresh remarks coming out of the BoJ suggest the central bank is in no rush to wind down its Quantitative/Qualitative Easing (QQE) Program with Yield-Curve Control as ‘many members expressed the view that, as there was still a long way to go to achieve the price stability target of 2 percent, it was necessary to maintain the current highly accommodative financial conditions.’ As a result, Governor Kuroda and Co. may stick to its wait-and-see approach at the next rate decision on April 27, but the BoJ may have little choice but to gradually alter the monetary policy outlook over the coming months as the central bank anticipated inflation to hit the 2% target in fiscal-year 2019.
Recent price action suggests the rebound from the 2018-low (105.25) has run its course following the failed attempt to close above the 106.70 (38.2% retracement) to 107.20 (61.8% retracement) region, while the Relative Strength Index (RSI) fails to break out of the bearish formation carried over from last year and now sits on trendline support.
USD/JPY DAILY CHART
(Click on image to enlarge)
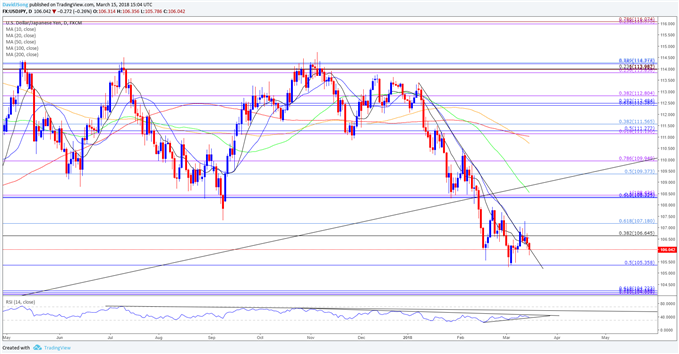
- May see USD/JPY extend the recent series of lower highs & lows as the bullish momentum abates, with the RSI on the cusp of flashing a bearish signal if it fails to hold trendline support.
- Need a break/close below 105.40 (50% retracement) bringing the downside targets back on the radar for USD/JPY, with the next region of interest coming in around 104.10 (78.6% retracement) to 104.20 (61.8% retracement).
AUD/USD SNAPS BULLISH SEQUENCE AS RECOVERY FLOPS AHEAD OF FEBRUARY HIGH
![]()
AUD/USD snaps the bullish sequence from earlier this week, with the failed attempt to test the February-high (0.7989) raising the risk for a larger pullback as market attention turns to the Federal Open Market Committee (FOMC) interest rate decision on March 21.
The limited reaction to the slew of mixed U.S. data prints from earlier today suggest the figures will do little to alter the monetary policy outlook, and Chairman Jerome Powell and Co. may largely endorse a hawkish outlook for monetary policy as the central bank appears to be following a similar path to 2017.
(Click on image to enlarge)
The majority of the FOMC may continue to project three rate-hikes for 2018 as fresh updates coming out of the U.S. economy shows a further improvement in labor market dynamics, and the recent strength in the greenback may persist going into the week ahead as market participants expect the central bank to further normalize monetary policy over the coming months. However, a growing number of Fed officials may highlight a more shallow path for the benchmark interest rate amid signs of slowing economic activity, and like the Bank of Canada (BoC), Chairman Powell and Co. may implement a dovish rate-hike as committee struggles to achieve the 2% target for inflation.
With that said, AUD/USD remains at risk of facing range-bound conditions over the near-term especially as the Reserve Bank of Australia (RBA) remains in no rush to lift the cash rate off of the record-low.
AUD/USD DAILY CHART
(Click on image to enlarge)
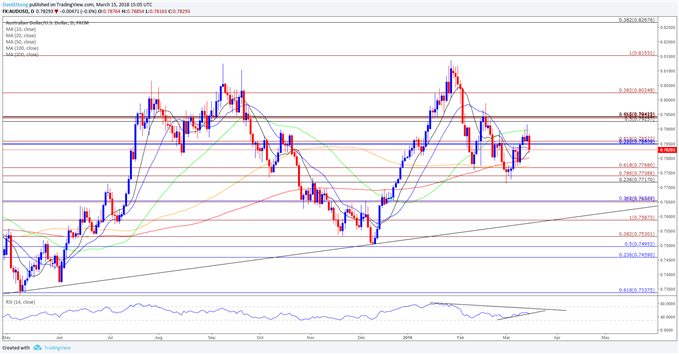
- AUD/USD may track the monthly range following the failed attempt to test the 0.7930 (50% retracement) to 0.7940 (61.8% retracement) region, with the pair at risk for a move back towards 0.7720 (23.6% retracement) to 0.7770 (61.8% expansion) as the bullish momentum abates.
- Keeping a close eye on the Relative Strength Index (RSI) as it appears to be breaking trendline support; may see a bearish trigger unfold as a broader correction appears to be underway, with the next downside region of interest coming in around 0.7650 (38.2% retracement) followed by 0.7590 (100% expansion)
(Click on image to enlarge)