
USD Is Pointing Higher In The Short-Term
Upcoming risk events:
- USD: Crude Oil Inventories.
- EUR: N/A.
- GBP: N/A.
- JPY: N/A.
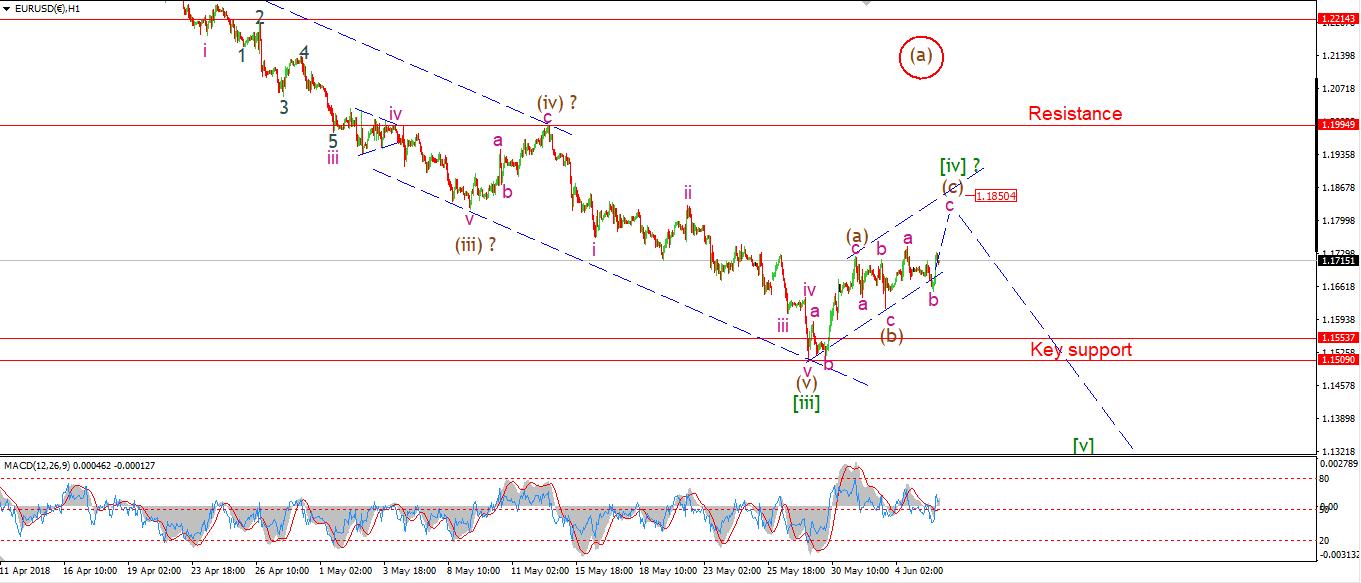
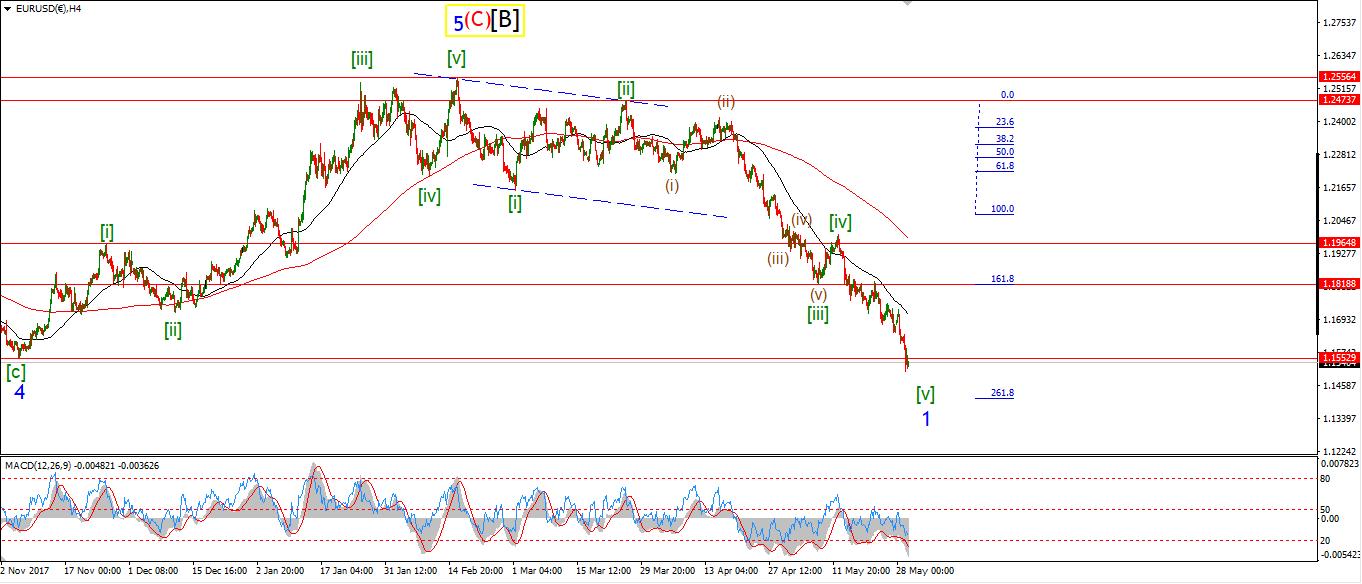
EURUSD
30 min
(Click on image to enlarge)
4 Hours
(Click on image to enlarge)
Daily
(Click on image to enlarge)
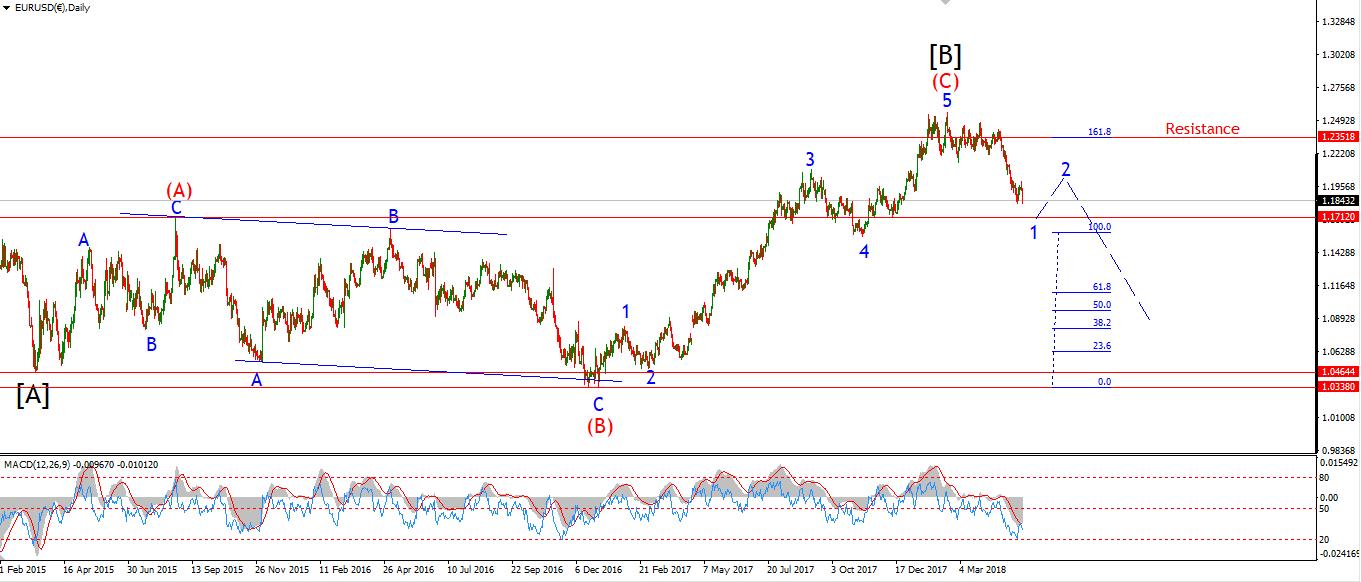
My Bias: long term bearish
Wave Structure: Topped in wave [B] black.
Long term wave count: lower in wave [C] black.
The corrective action in EURUSD has confirmed my suspicions today. The price is likely moving higher in a double combination Elliott wave pattern. The drop-off on Monday's high has developed into a three wave pattern. I have labelled this an internal wave 'b' of the larger wave (c) up. The target for wave (C) remains in the region of 1.1800.
Tomorrow, watch for wave 'c' pink to continue towards he upper trendline at 1.1800. At that point we will have a three wave pattern complete in a possible wave [iv]. I will then switch focus to wave [v] down.
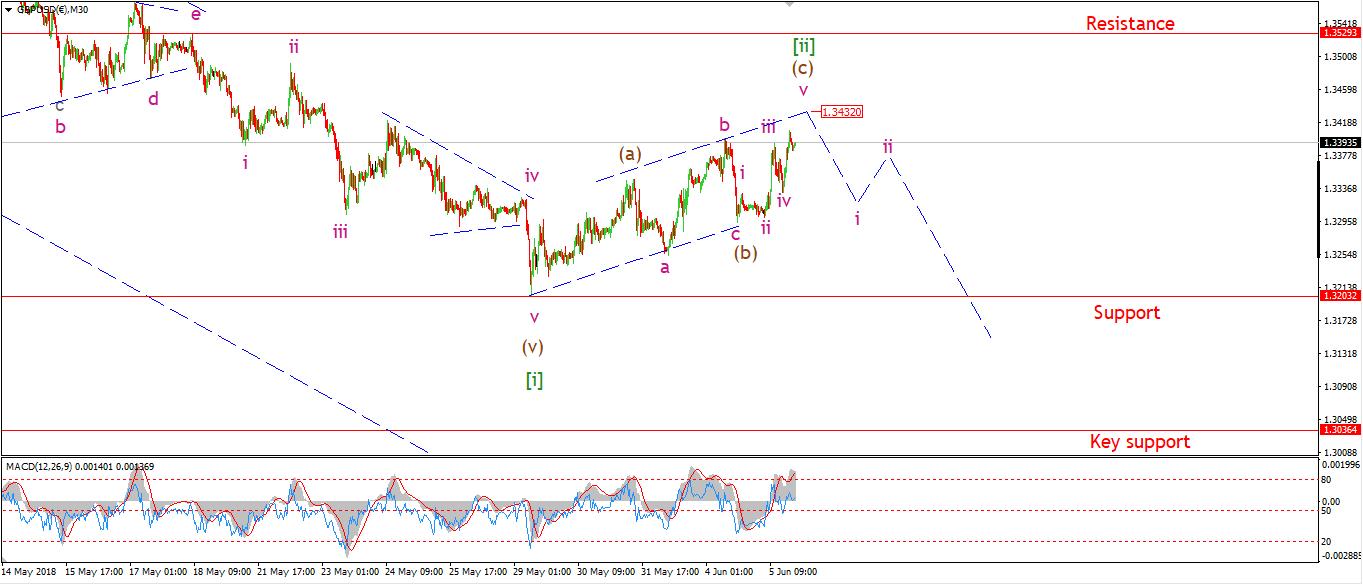
GBPUSD
30 min
(Click on image to enlarge)
4 Hours
(Click on image to enlarge)
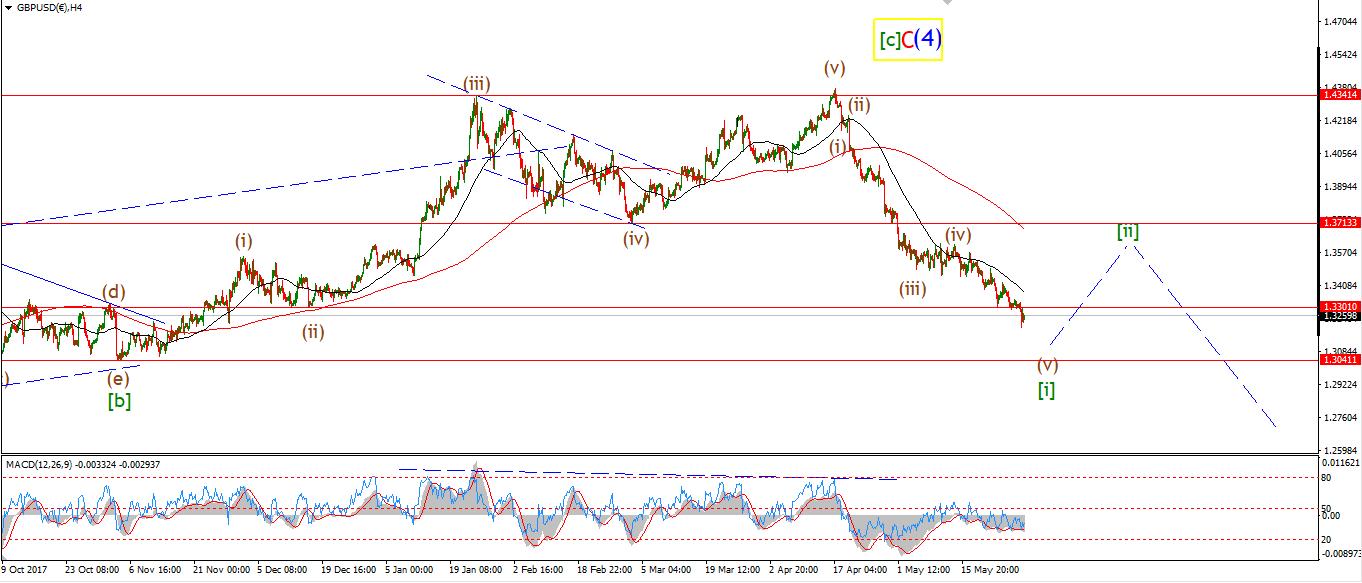
Daily
(Click on image to enlarge)
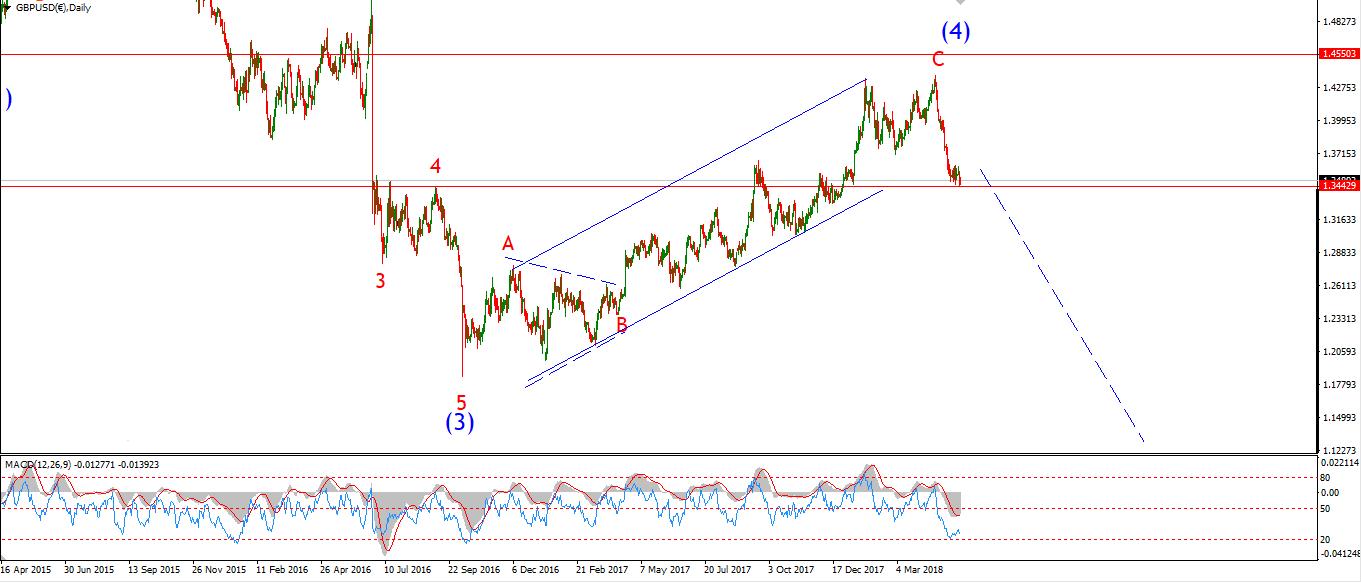
My Bias: short below parity in wave (5).
Wave Structure:completed wave (4) blue correction higher.
Long term wave count: decline in wave (5) blue, below parity
I have altered the short term wave count in wave [ii] green very slightly today. After today's rally the pattern in wave [ii] has taken the form of a complex flat. The internal wave (b) is a running flat, and the price has rallied-off that low in a five wave pattern wave (c).
that gives us a 3,3,5 overall structure. The price is approaching the upper trendline fast today. The target for wave (c) lies at about 1.3430. But wave (c) has already broken the high of wave (a). So, the structure may even be complete at today's high of 1.3408
Tomorrow, watch for wave (c) to complete at 1.3430 and an initial turn down in wave wave (i). By the end of the week we should have an elliott wave indicator sell signal in place in Cable, so eyes on here!
USDJPY
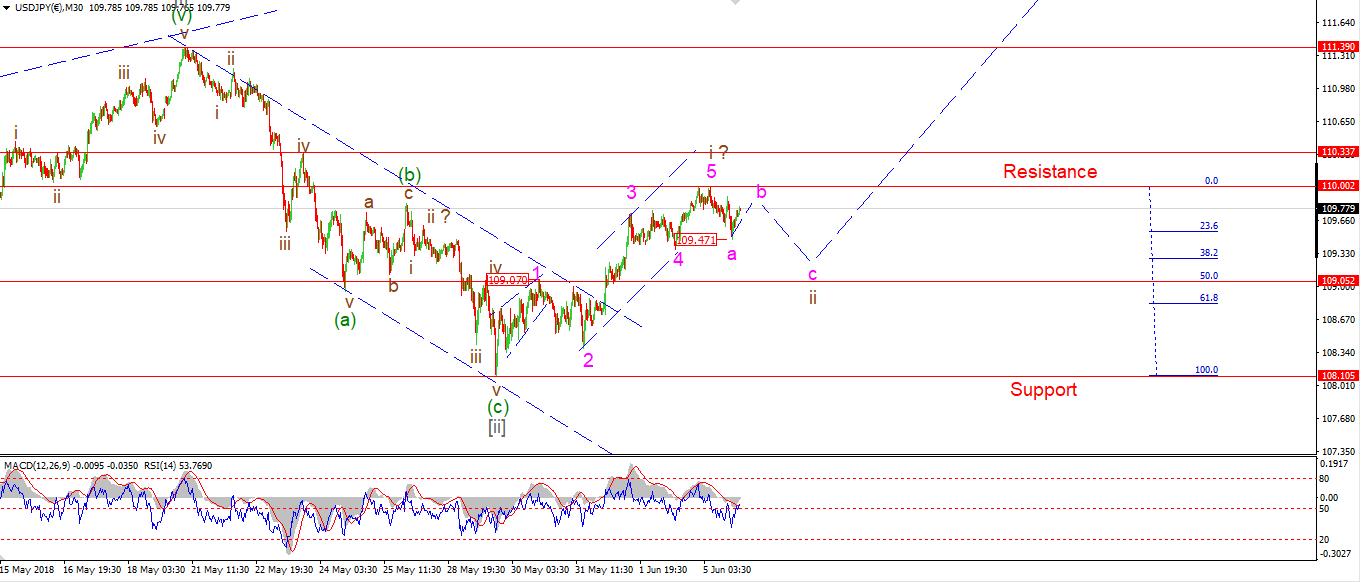
30 min
(Click on image to enlarge)
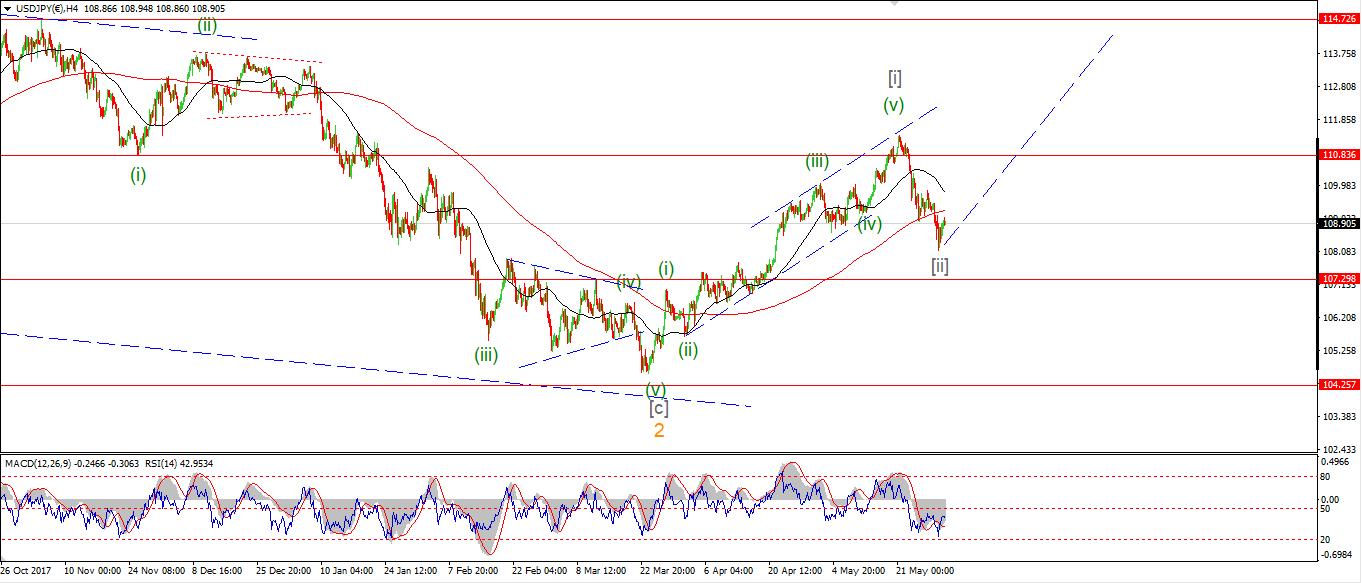
4 Hours
(Click on image to enlarge)
Daily
(Click on image to enlarge)
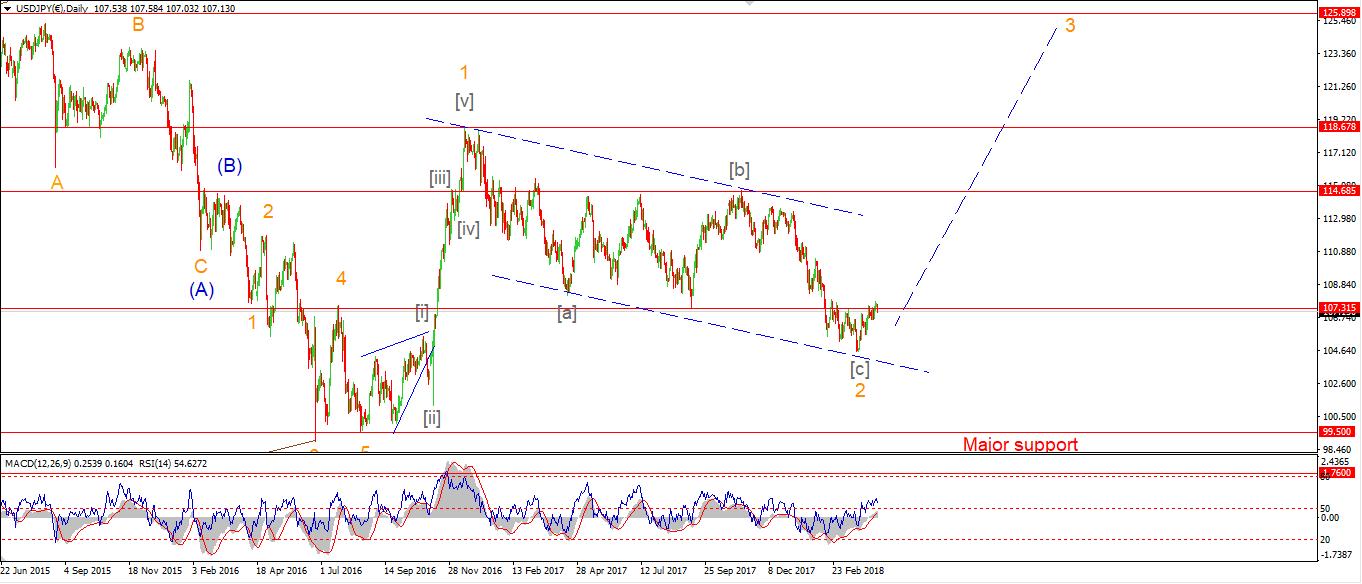
My Bias: LONG
Wave Structure: rally in wave [C]
Long term wave count: wave [C] is underway, upside to above 136.00
USDJPY broke above the 110.00 level today, only just! The high of the session reached 110.002 and off the high we can see a corrective decline beginning. We can now identify elliott wave 1 as complete with five waves up. It is likely that wave 'ii' brown has now begun.
I have labelled wave 'a' down complete at today's lows of 109.47. Wave 'b' is underway and should complete below 110.002. The initial target for wave 'c' of 'ii' lies at the 50% retracement level at 109.05.
Tomorrow, watch for wave 'b' to complete in three waves, and wave 'c' pink to trace out five waves down into 109.05.
Want to know the next big move in the Dollar, GOLD and the DOW?
Check out our membership plan over at ...
more

