
USA Economic Outlook Appears Stable
There is no question that the economy is not running on all cylinders - but despite some pundits claiming the economy is about to crash - there is no evidence in the data using the current forecasting models.

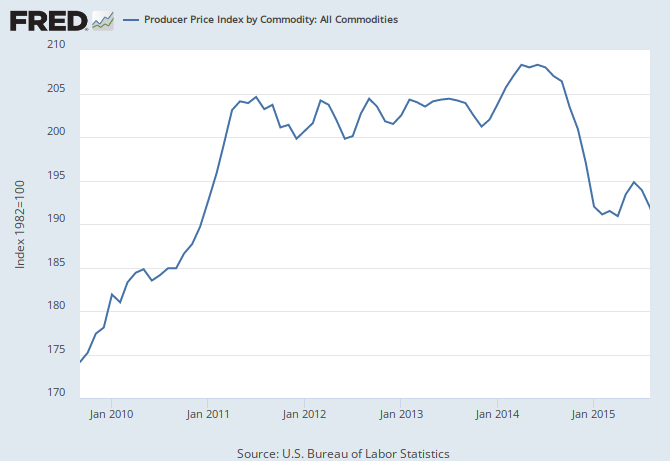
You have heard the saying "this time is different". One never should be certain that you are not facing a situation which will yield a different result than the data would indicate. In fact, if I were using the economic models I used last century - I would be screaming RECESSION. Last century commodity price decline combined with commodity demand decline were the bellwether of USA and global recessions.
The main mover of commodities - rail - is in contraction.

The 12 month rail rolling average has been in decline since the beginning of 2015.
But something changed in the 21st century, and old models stopped working. This is not to say that major commodity exporting countries like Australia and Canada will not suffer, but overall the commodity decline is not having an overwhelming impact on the global economies. Note that the Great Recession was not foreseen by the 20th century models in use at that time - and most are now using unproven 21st century versions.
Commodities are necessary to build things - and it is obvious that the world is requiring less "things". Not building "things" is no longer the main prelude to recession.
Our model of the economy released this week for October shows stable but relatively weak growth. Commodity movements are part of our economic model - but contraction of commodities does not send our index into contraction. It is the consumer which is keeping the ship afloat. However, the ratio of spending to income is again over 0.92 - and has been elevated since Jan 2013. There have been only four periods in history where the ratio of spending to income has exceeded 0.92 (April 1987, the months surrounding the 2001 recession, from September 2004 to the beginning of the 2007 Great Recession, and for some occasions since late 2013). A high ratio of spending to income acts as a constraint to any major expansion in consumer spending.
Seasonally Adjusted Spending's Ratio to Income (a increasing ratio means Consumer is spending more of Income)

So if the consumer is the reason for a positive economic forecast, one should also note that the consumer has little ability to spend more.
Other Economic News this Week:
The Econintersect Economic Index for October 2015 was statistically unchanged from September - and remains in the low range of index values seen since the end of the Great Recession. The tracked sectors of the economy generally showed some growth. Our economic index remains in a long term decline since late 2014.
The ECRI WLI growth index is now in positive territory but still indicates the economy will have little growth 6 months from today.
Current ECRI WLI Growth Index

The market was expecting the weekly initial unemployment claims at 270 K to 278 K (consensus 272,000) vs the 277,000 reported. The more important (because of the volatility in the weekly reported claims and seasonality errors in adjusting the data) 4 week moving average moved from 271,750 (reported last week as 271,750) to 270,750. The rolling averages generally have been equal to or under 300,000 since August 2014.
Weekly Initial Unemployment Claims - 4 Week Average - Seasonally Adjusted - 2011 (red line), 2012 (green line), 2013 (blue line), 2014 (orange line), 2015 (violet line)

Bankruptcies this Week: Japan-based Daiichi Chuo Kisen Kaisha (Chapter 15), Miller Energy Resources, Interphase (Chapter 7)
Disclosure: None.


