
U.S. Treasuries: A Little Bit Of March Madness
With the NCAA basketball tournament in full swing, one couldn’t help thinking the last month of trading activity in the U.S. Treasury (UST) market resembled its own version of March Madness. Indeed, there have been a variety of twists and turns in the headlines that helped create this environment, with the results heading into the end of the quarter perhaps not quite what was expected a few weeks ago.
Without a doubt, developments in the nation’s capital have taken center stage, from both a monetary policy and a political perspective. While the period from late February to mid-March was dominated by the Federal Reserve (Fed), the second half of March has seen the health care debate dominating the news. Some market participants have inquired as to why the House vote on the Affordable Care Act would impact the Treasury market. In the minds of the investor at large, this vote was being viewed as a litmus test for both the executive and the legislative branch, both led by Republicans. In other words, failure for the House to pass its own health care bill (despite heavy involvement from the Trump administration) would be viewed as a noteworthy failure and perhaps represent a harbinger of future difficulties for the president’s ambitious fiscal policy agenda. Put simply, the expected action for tax reform may (a) be pushed out even further this year, and (b) face its own hurdles for agreement and ultimate passage. Thus, the much ballyhooed “Trump Reflation Trade” may not come to fruition in 2017.
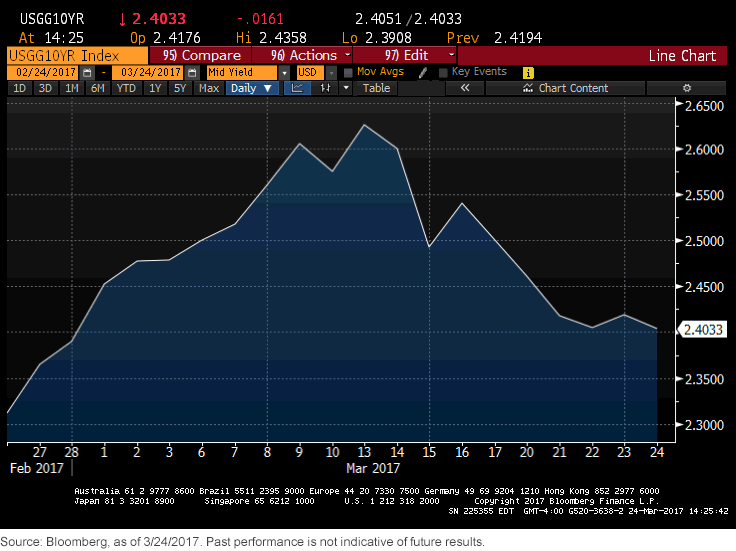
Let’s work backwards and take a look at the March FOMC meeting. Certainly, the changing perceptions for this convocation played an integral role in the rising trajectory of the UST 10-year yield heading into ‘decision day’ on March 15th. To be sure, the 10-year yield went from a low of 2.31% on February 24th to a peak reading of 2.63% the day before the meeting, as market expectations went from about a one-third chance of a rate hike to essentially 100% as the policymakers were convening.
A funny thing then happened post-FOMC meeting, the UST 10-year yield fell by more than 10 basis points (bps). While the voting members did deliver another ¼ point increase in their fed funds target range, the Fed’s future rate outlook did not signal any additional hawkish tilt. So, even though the timing of the first rate hike in 2017 had been seemingly pushed up three months (March vs. June), the markets ‘worst’ fears were not realized. That brings us to where the UST 10-year yield market stood as of this writing, 2.40%, or almost 25bp below the aforementioned peak level, a situation that one would not have necessarily envisioned prior to this latest Fed tightening move.
Conclusion
The enclosed graph provides a clear illustration of how UST 10-Year trading activity looked during the last month. What should investors take away from this movement? Since around mid-December, the yield level has hit or moved over the 2.60% threshold a handful of times, and in each instance the UST rallied, with rates falling accordingly. From a technical perspective, using Fibonacci support/resistance analysis, the 2.64% reading represents a 76.4% retracement from the all-time low registered on July 8 of last year and appears to be at a level where buyers come back into the market, at least for now. Against this backdrop, barring any unforeseen circumstances, the near-term trading range for the UST 10-Year appears to have gravitated towards a 2.25%–2.65% band. But stay tuned—the year is only one-quarter over.
Disclosure: None.
Disclaimer: There are risks associated with investing, including possible loss of principal. Foreign investing involves special risks, such as risk of loss from ...
more

