US Real Estate Sector Nosedive
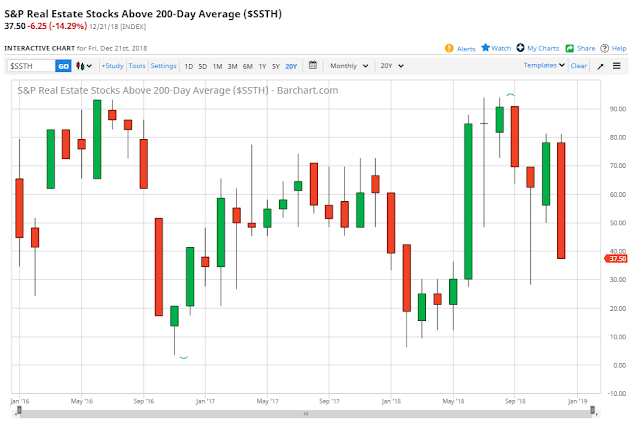
Further to my post of December 17, the percentage of S&P Real Estate stocks above their 200-day moving average has dropped below 50% to 37.5% (as of Friday's close), as shown on the following graphic. At 50% on that date, it was the "last man standing," apart from Utilities.

The monthly action of this percentage relative to its 200 MA is illustrated in chart form, as follows. While the SPX was making a new all-time high in September, the real estate stocks were on their way down.
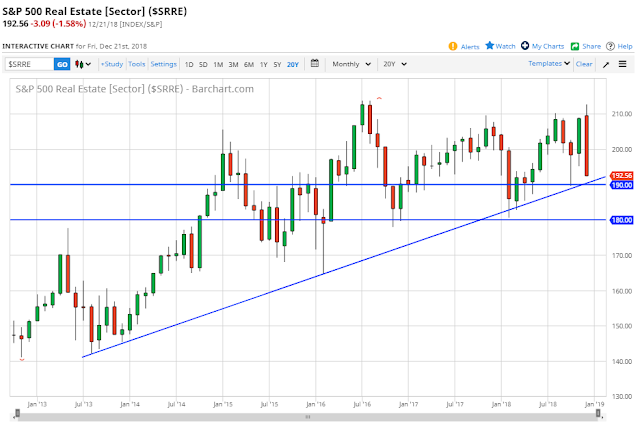
The actual Real Estate Sector ($SSRE) is depicted on the following monthly chart. Price is approaching near-term support at 190.00. A drop and hold below that could see it drop to major support at 180.00, or lower.
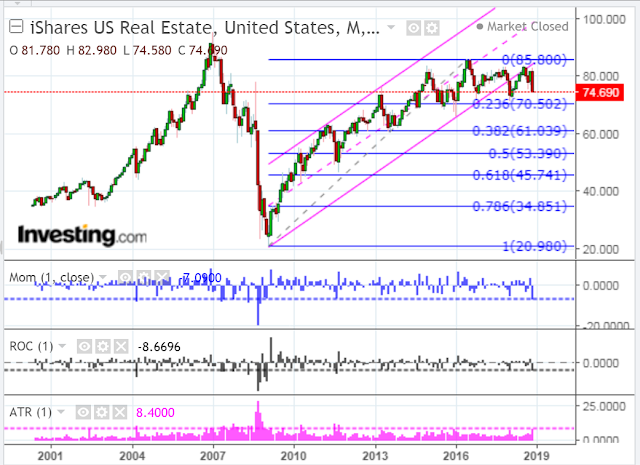
The following monthly chart of the Real Estate ETF (IYR) shows that the first Fibonacci retracement support level sits at 70.50. A drop and hold below that could see it reach its next Fib level at 61.00.
Both the IYR and $SSRE are range-bound with a very large range for December. Further weakness in these would, no doubt, drag the S&P 500 Index (SPX) further down. The SPX gauges that I'm monitoring in the short term are described in my post of December 22. If we see the SPX stabilize or bounce, it will be important to see whether the real estate sector does, as well.