US Dollar Smashed After CPI: When Good News Goes Bad
DOLLAR BEARS COME BACK AFTER YESTERDAY’S CPI-INDUCED SPIKE
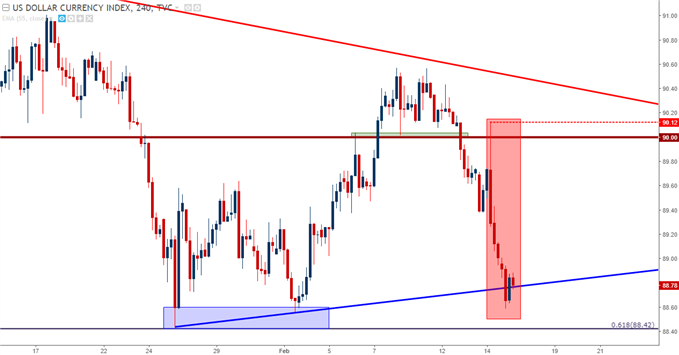
Yesterday’s Dollar-strength on the back of the US inflation report was short-lived. After getting a quick pop above the 90.00 level on DXY, Dollar bears came back with a vengeance and pushed prices all the way down towards the February lows, which are very near the three year-lows in the Greenback set in latter-January. This made for a rather impressive -1.7% run in DXY prices from yesterday’s high down to this morning’s low; and while this may not be the eye-popping double digit moves that can often be seen in equities, this is a -1.7% movement is for a non-levered currency; making for a notable move in a 24-hour period.
US DOLLAR VIA ‘DXY’ FOUR-HOUR CHART: BEARS COME BACK WITH A VENGEANCE AFTER TEST OF 90.00
(Click on image to enlarge)
10-YEAR US TREASURY YIELDS CROSS 2.9%
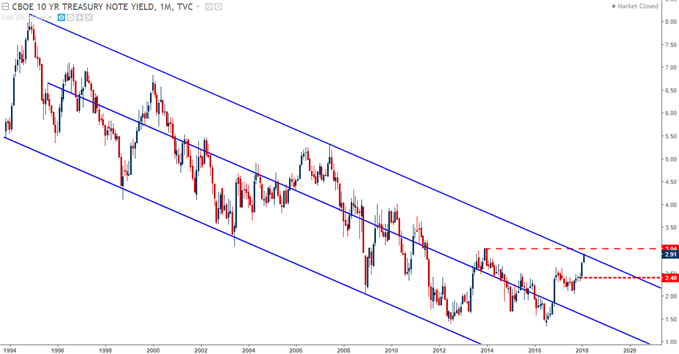
This move in the Dollar goes along with a continuation of selling in US Treasuries. Yesterday’s price action in the 10-year saw another fresh four year-high as yields are now above the 2.9% marker; furthering the outsized jump so far in 2018 after the 10-year hovered around 2.4% in December. This is a big move in a vitally important instrument in a very short period of time, and we’re fast approaching the seven-year high at 3.04%.
US TREASURY YIELD ON 10-YEAR NOTE, MONTHLY CHART: FAST APPROACHING SEVEN-YEAR HIGH 3.04%
(Click on image to enlarge)
THE US EQUITY BID CONTINUES AFTER YESTERDAY’S CPI-INDUCED DIP
Earlier in the month, that rise in yields had seemed to really grab the attention of equity investors. Stocks took a hit in the early-part of February, and after spending much of last week under pressure, bids have returned to push prices off of support. Yesterday produced a great example of the ‘buy-the-dip’ crowd at work, as a quick dip developed on the back of that US inflation report ahead of the US open. But, as American equity markets came online, buyers pushed prices higher and we’re back above 2,700 on SPX futures ahead of this morning’s open. Last week saw a swing show-up around 2726, and this could be looked at as an area of short-term resistance should this near-term rally continue:
SPX500 30-MINUTE CHART: CPI-INDUCED DIP BOUGHT, BUYERS PUSH THEREAFTER
(Click on image to enlarge)

On a longer-term basis, this would seem to suggest a continuation in what markets have come to rely upon over the past nine years, which is persistent strength in stocks as government backstops help to smooth the gyrations of the business cycle throughout the global economy. But as that Central Bank accommodation has started to get pulled back, questions have arisen around the viability of equities continuing in their bullish ways, unfettered by the rather aggressive historical valuations that have built-up.
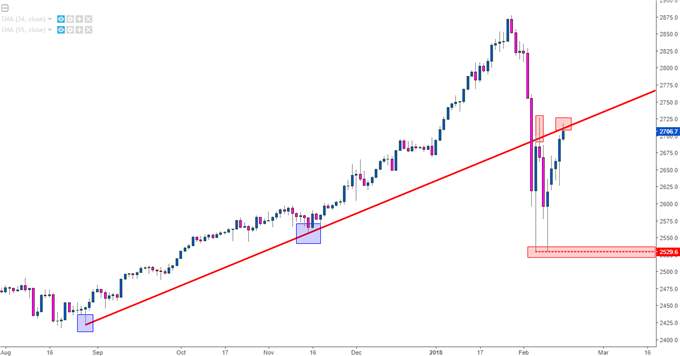
On the daily chart of the S&P, we can see prices are now testing the under-side of a prior bullish trend-line that had been in-play since September of last year. A double bottom formation has built around this month’s lows in the 2530 area after the early-month sell-off wiped out four months of gains. So, while the general tonality here is still bullish, there is bearish potential, particularly if that double-bottom gets violated which could lead to short-side breakouts as new lows print.
SPX500 DAILY CHART: TESTING UNDER-SIDE OF PRIOR BULLISH TREND-LINE
(Click on image to enlarge)
YEN RALLY CONTINUES AFTER FINANCE MINISTER TALKS DOWN INTERVENTION
Something is going on with the Japanese Yen. We discussed this yesterday in our technical article on GBP/JPY, noting that a backdrop of seemingly ‘good’ items appear to be getting little bullish response in the pair. Out of the UK, we had last week’s hawkish twist at the BoE and this week’s 3% inflation print. And out of Japan - it appears as though Haruhiko Kuroda is headed for a second term atop the BoJ, and given that he’s the architect of the massive Japanese QE program, it would seem as though the BoJ will remain on track with their gargantuan stimulus program. While inflation has started to tick a bit higher, Japan still lags major economies in the US and Europe; and after the countries decades-long struggle with deflatoin or a lack of inflation, the BoJ has appeared committed to their program until 2% inflatoin begins to show.
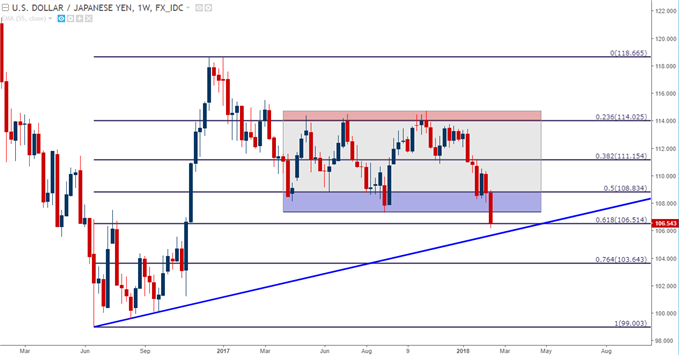
But – that driver has appeared to bring little interest from Yen bears, as the currency went on a strong drive earlier in the week that’s continued as USD/JPY has fallen-down to fresh 14-month lows. Some element of support appears to be showing around the 61.8% Fibonacci retracement of the June-December, 2016 major move.
USD/JPY WEEKLY CHART: BREAKDOWN OF RANGE, 61.8% SUPPORT
(Click on image to enlarge)
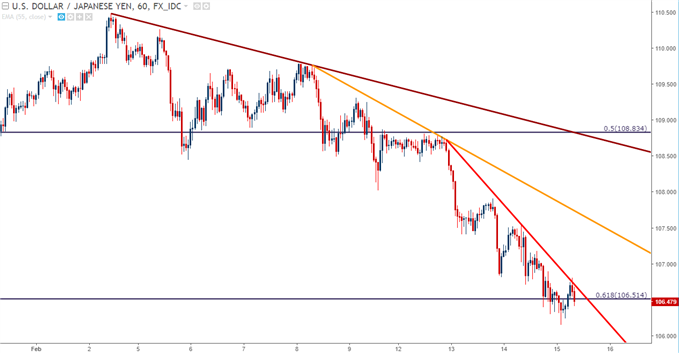
The natural question given this backdrop of aggressive Yen-strength was whether or not the Finance ministry out of Japan would step-in to buffer the move. That was negated last night when Japanese Finance Minister, Taro Aso, said that the gains in the Yen were not yet enough to begin discussing intervention. This added more fuel to the fire as that Yen-strength increased in the overnight session, currently finding a bit of resistance (support in pairs in which JPY is the counter currency) above the 106.00 level in USD/JPY.
Notable, however, is how bearish drive has continued to increase in the pair throughout the month, as the angle of the below trend-lines has continued to get more bearish throughout the month of February.
USD/JPY HOURLY: PACE OF SELLING INCREASING AS DENOTED BY ANGLE OF FEBRUARY BEARISH TREND-LINES
(Click on image to enlarge)
REMAIN BALANCED
The key for the trader, whether macro markets are in some grander theme of shift or not, should be to remain balanced. With prudent risk management, a balanced approach can bring considerable benefit to the trader as it can afford them the opportunity to strategize their approach across markets while minimizing the necessity of ‘guessing’.
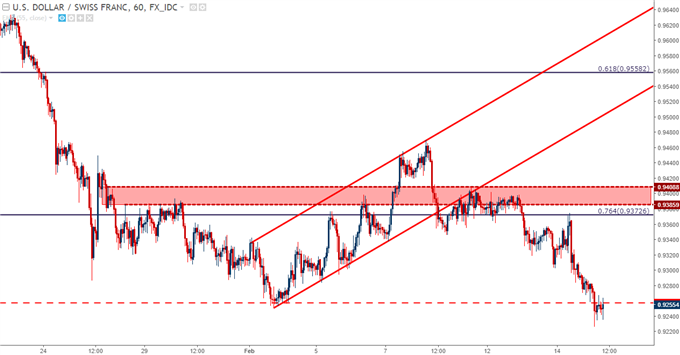
In yesterday’s article as well as the previous day’s webinar, we looked at setups on either side of the Dollar, nothing the intense AUD/USD weakness that’s showed since latter-January, while picking on USD/CHF for USD-weakness as the pair has built-in to a smooth bearish trend. With the return of USD-weakness in the aftermath of yesterday’s CPI report, USD/CHF surged down to a fresh two-year low, which had previously rebuffed a bearish advance around .9257.
USD/CHF HOURLY CHART: FRESH TWO-YEAR LOWS AS USD-WEAKNESS TAKES OVER
(Click on image to enlarge)
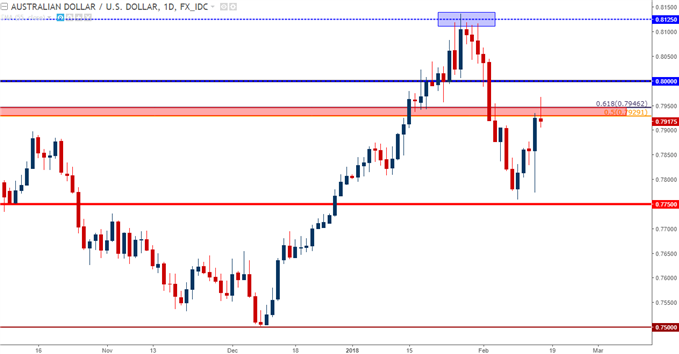
AUD/USD ripped aggressively yesterday, and is now finding some element of resistance at a confluent zone of interest, just inside of the .8000 big figure. The levels of .7929 and .7946 are derived from longer-term Fibonacci studies, and collectively help to produce a confluent zone of resistance. While today’s daily bar is still far from closing, if we do get a doji or any other element of indecision showing on today’s print, the door can start to open for short-side continuation strategies.
AUD/USD DAILY: RESISTANCE POTENTIAL AT CONFLUENT ZONE .7929-.7946
(Click on image to enlarge)