Tuesday, November 14, 2017 1:08 PM EDT
DXY Daily Chart


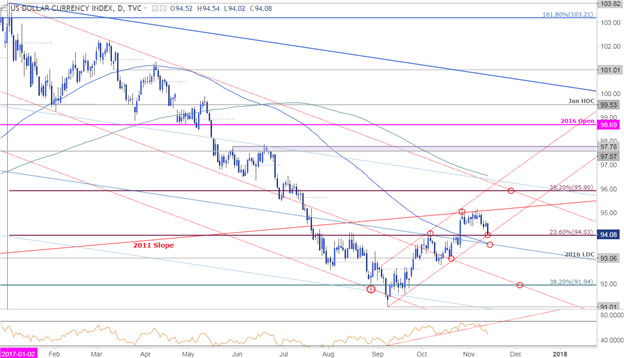
Technical Outlook: We’ve been tracking a long-term slope line dating back to 2011 and in last week’s Technical Outlook, we highlighted the risk for a pullback while below this key threshold. The subsequent decline is now testing initial support at the 94-handle where basic channel support converges on the broader 23.6% retracement of the yearly range. A break lower still has to contend with the 100-day moving average / median-line (blue) at ~93.60s – a close below this region is needed to suggest that a more significant high is in place.
DXY 240min Chart
(Click on image to enlarge)
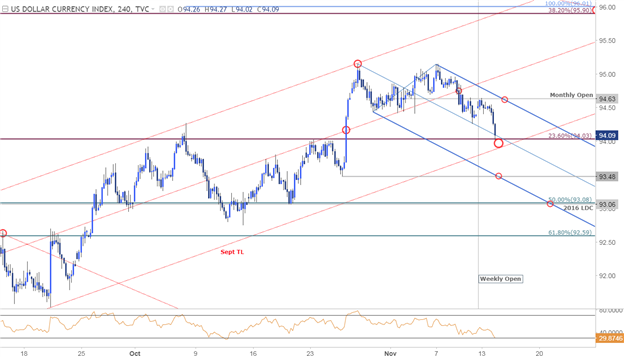
Notes: A closer look at price action further highlights this near-term support zone around the figure. Resistance stands with the November open / weekly opening-range high at 94.63 with a breach above the ascending median-line (red) needed to shift the focus back to the long-side in the index.
Bottom line: The index is testing initial support and while we could see some immediate relief here, the focus remains lower while within this near-term descending pitchfork formation (blue). Keep in mind that we have the release of the U.S. Consumer Price Index (CPI) tomorrow with the event likely to spark increased volatility in the USD crosses.
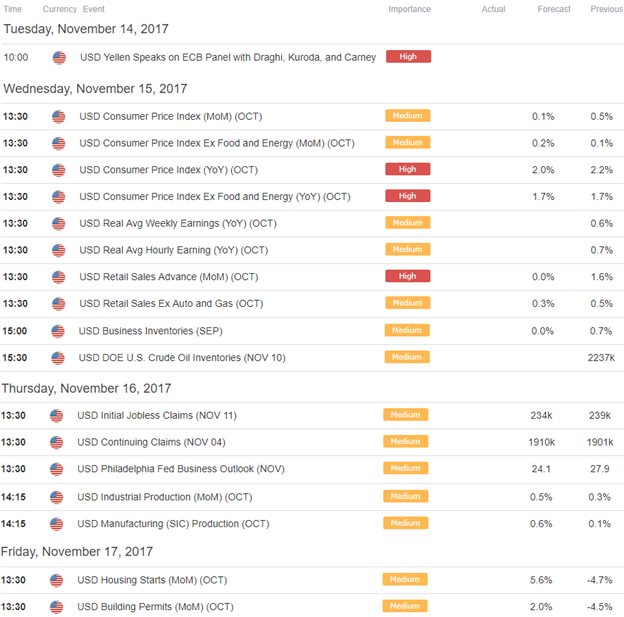
Relevant Data Releases
(Click on image to enlarge)
Disclosure: DailyFX, the free news and research website of leading forex and CFD broker FXCM, delivers up-to-date analysis of the ...
more
Disclosure: DailyFX, the free news and research website of leading forex and CFD broker FXCM, delivers up-to-date analysis of the fundamental and technical influences driving the currency and commodity markets. With nine internationally-based analysts publishing over 30 articles and producing 5 video news updates daily, DailyFX offers in-depth coverage of price action, predictions of likely market moves, and exhaustive interpretations of salient economic and political developments. DailyFX is also home to one of the most powerful economic calendars available on the web, complete with advanced sorting capabilities, detailed descriptions of upcoming events on the economic docket, and projections of how economic report data will impact the markets. Combined with the free charts and live rate updates featured on DailyFX, the DailyFX economic calendar is an invaluable resource for traders who heavily rely on the news for their trading strategies. Additionally, DailyFX serves as a portal to one the most vibrant online discussion forums in the forex trading community. Avoiding market noise and the irrelevant personal commentary that plague many forex blogs and forums, the DailyFX Forum has established a reputation as being a place where real traders go to talk about serious trading.
Any opinions, news, research, analyses, prices, or other information contained on dailyfx.com are provided as general market commentary, and does not constitute investment advice. Dailyfx will not accept liability for any loss or damage, including without limitation to, any loss of profit, which may arise directly or indirectly from use of or reliance on such information.
** All times listed in GMT. See the full DailyFX economic calendar here.
less
How did you like this article? Let us know so we can better customize your reading experience.


