
U.S. Dollar Rally: A Tale Of Two Chart Patterns

The U.S. Dollar Index has been trading in a wide consolidation pattern over the last 18 months or so. But after the recent U.S. Dollar rally, that consolidation has formed two distinct chart patterns.
And as you may have guessed… one is bullish while the other is bearish.
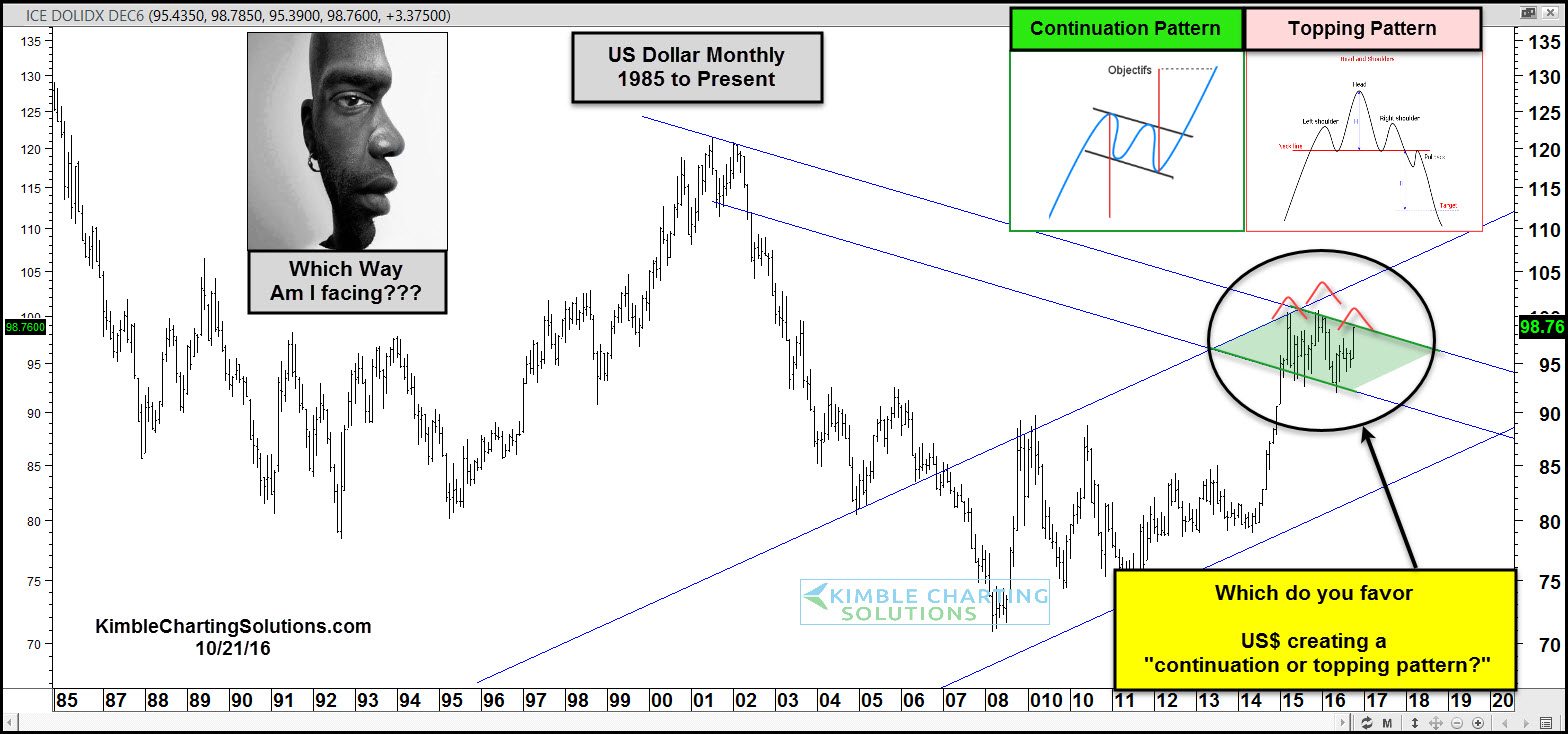
As you can see in the chart below, the recent Dollar rally has kept bulls in the game. The now 18 months long consolidation appears to be a “flag” continuation pattern. BUT, that would only be confirmed with a breakout over the upper resistance line, followed by new highs.
But there’s two ways to look at this pattern. The second (and bearish) chart pattern is a head and shoulders topping pattern. In this event, bears would want resistance to hold and for the Dollar to move lower (and through lower trend line support.
The implications here are huge. A breakout higher would likely affect commodities while disturbing equities markets as well. On the flip side, should the U.S. Dollar rally stall here, bears would be given new life. And a lower Dollar would act as a tailwind to commodities and perhaps other risk assets.
(Click on image to enlarge)
If you would like to stay abreast of the Power of the Pattern in the metals space, would be honored if you were a more


