
US Dollar Likely To Post A Recovery
Daily Forex Market Preview, 02/08/2016
Following Friday's NFP report which showed the US unemployment rate fall below the 5.0% threshold, the markets were unsure how to react. Gold retreated after the NFP release, only to regain its footing and closed at a 4-month high near 1174. With no major releases due today, the markets are likely to settle into a range as investors digest the implications of the January jobs report.
EURUSD Daily Analysis
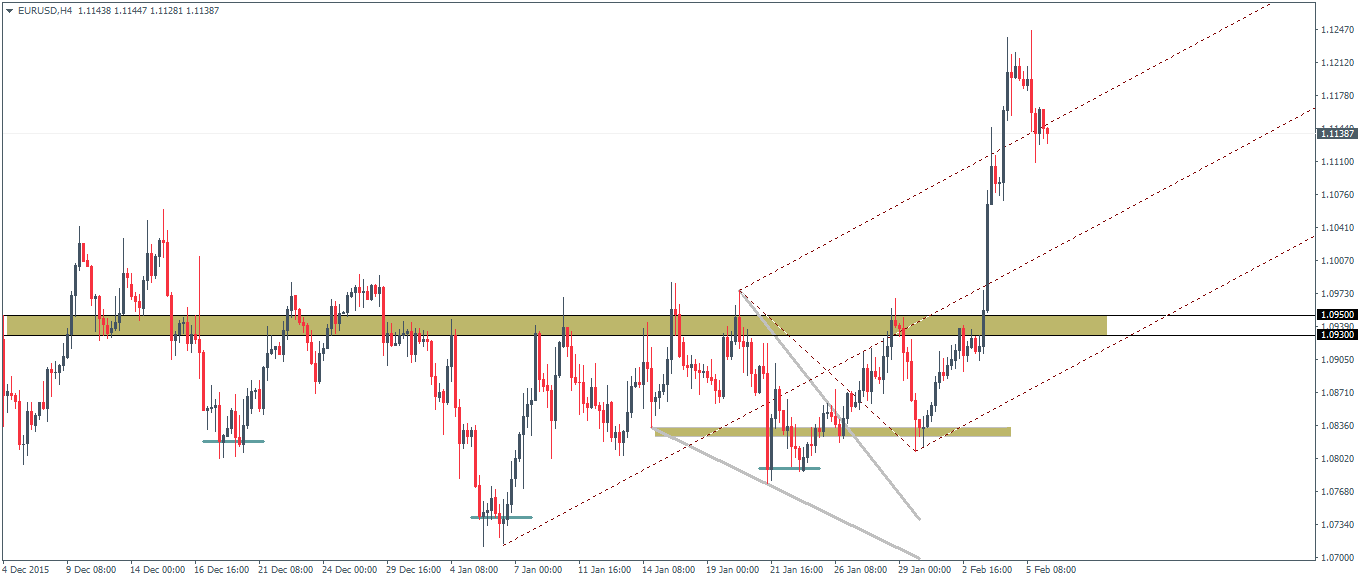
EURUSD (1.11): The resistance zone of 1.13 - 1.12 looks to be capping the rally as of now and EURUSD could be looking to post a correction down to 1.105 which is the initial minor support. A break below 1.105 will see a test to 1.093 - 1.095 support, which marks the inverse head and shoulders broken resistance level. A decline back to establish resistance will likely see another leg to the upside. However, in the event of a break below 1.093, EURUSD could post some quick declines down to the previous right shoulder region near 1.08 - 1.082. A potential lower close today below Friday's low of 1.1108 could signal further declines.
USDJPY Daily Analysis
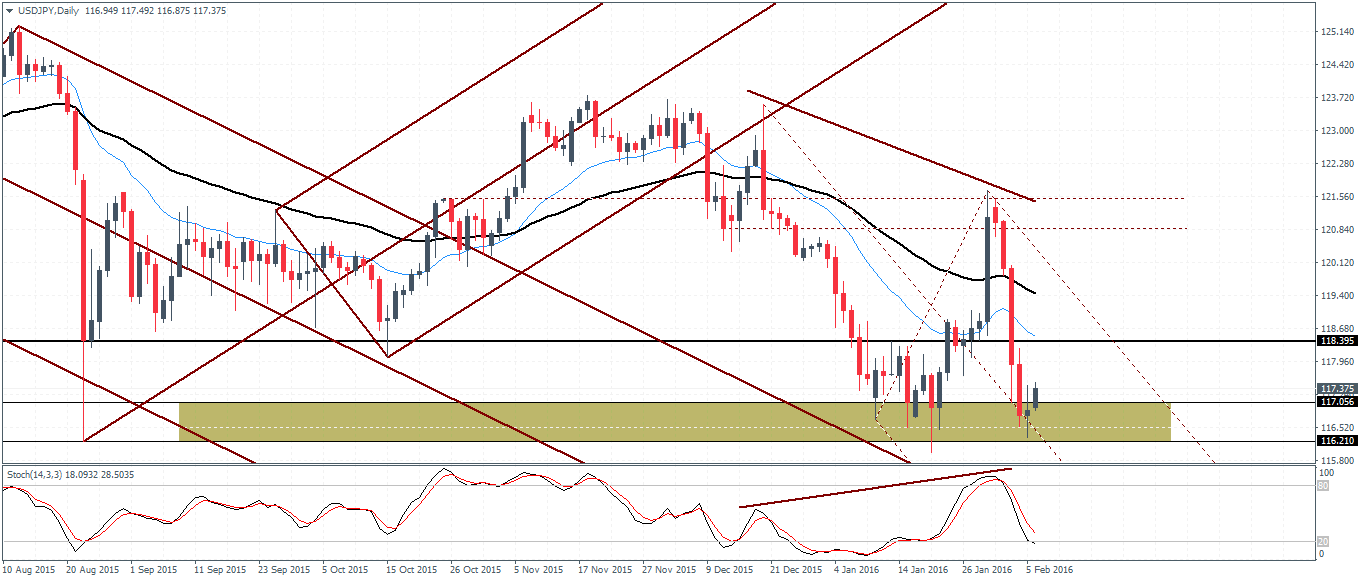
USDJPY (117.4): USDJPY has formed a doji/spinning bottom pattern on the daily session on Friday near the support zone of 117 - 116 region. A close above Friday's high of 117.429 could signal further upside for a test to 118.395. For the moment, price action is likely to sway between the resistance and support levels. Above 118.395 resistance, 120.12 comes in as the next resistance of interest, while to the downside, a break below 117.05 could signal another move lower to 116. The declines off 121 came as the Stochastics posted a hidden bearish divergence and currently, the oscillator is failing to confirm the lows in price, indicating a correction to the upside, which should see another test to 120 in the near term.
GBPUSD Daily Analysis
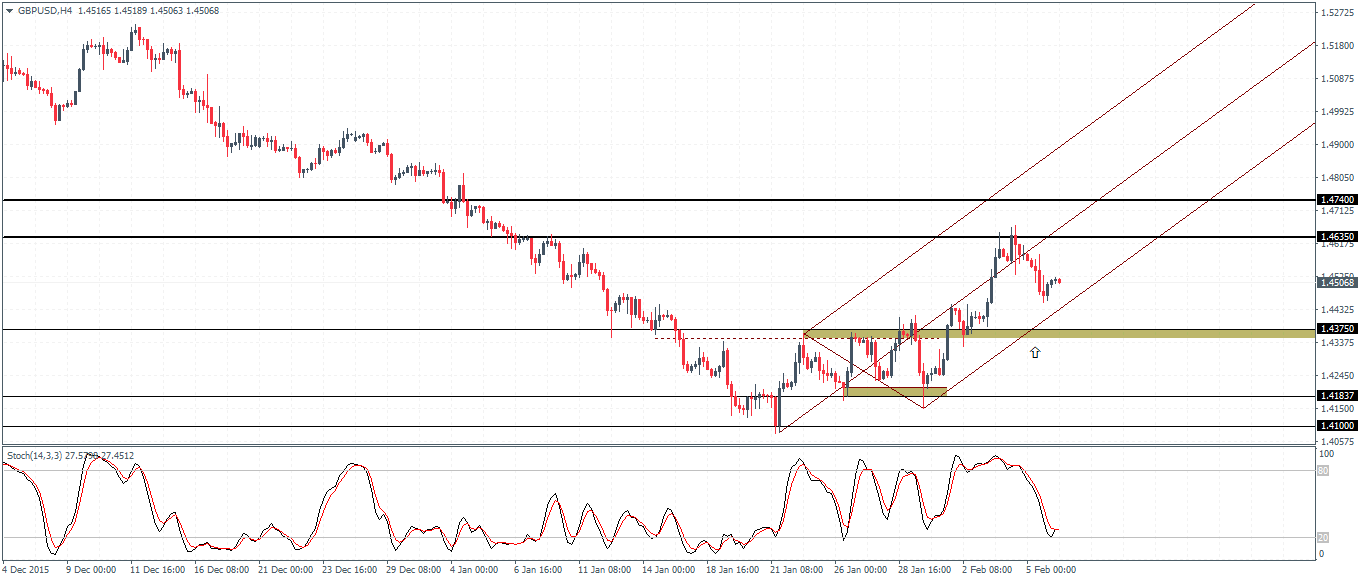
GBPUSD (1.45): GBPUSD has stalled in its rally near 1.4743 - 1.4635 resistance. After the doji candlestick pattern on Thursday, prices closed bearish in Friday's session indicating a move to the downside, confirmed by a close below the doji's low of 1.45299. A pullback to the low is possible followed by a decline to 1.435 - 1.43 at the very least. The 4-hour chart time frame has printed a bearish divergence, confirming the correction down to 1.43 - 1.435 region
Gold Daily Analysis
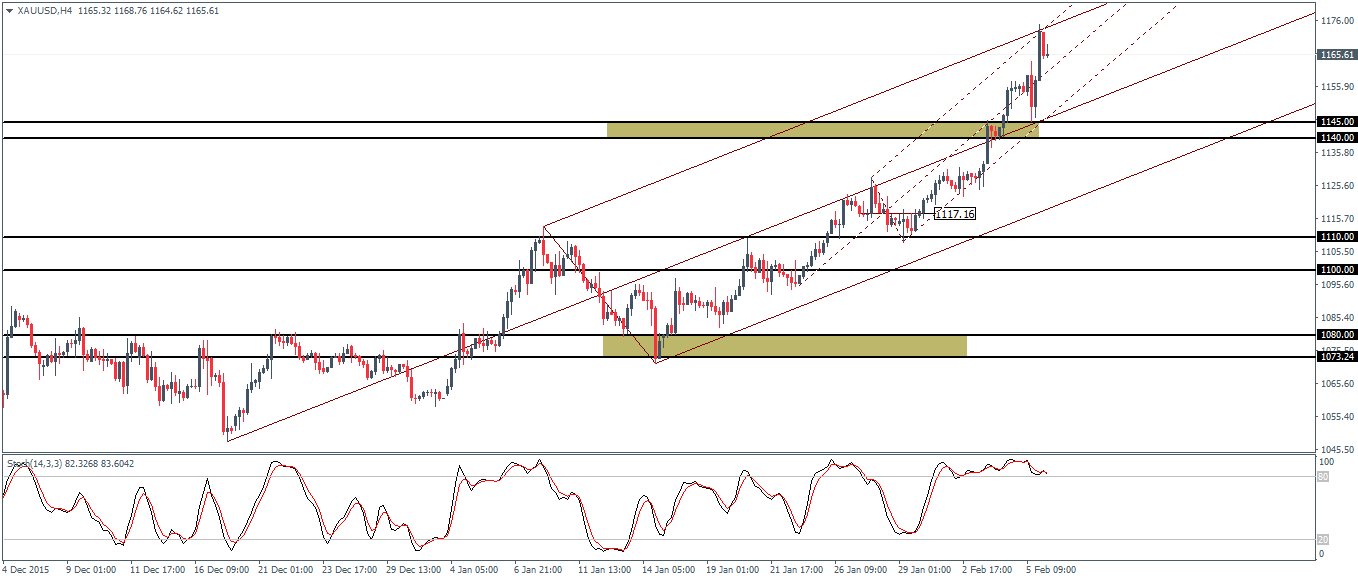
XAUUSD (1165): Gold prices rallied strongly on Friday and posted a 4-month high at 1174.63. Prices have started to retreat off this high with a possible retest back to 1145 minor support. Price action has currently formed an inside bar on the 4-hour chart time frame, and a breakout to the downside could see a test to 1145 - 1140 support initially. A break below 1140 support could signal a move lower to 1110 support. To the upside, it is possible that the momentum has exhausted and any further attempts to rally is likely to be shortlived.
Disclaimer: Orbex LIMITED is a fully licensed and Regulated Cyprus Investment Firm (CIF) governed and supervised by the Cyprus Securities and Exchange Commission ...
more

