
US Dollar: It Ain’t Over Till It’s Over
“It is in the nature of the human being to seek a justification for his actions.” ― Aleksandar Solzhenitsyn
Despite the rising probability, along with increasing sentiment and real positioning, suggesting the US dollar cyclical bull market rally is over (ending with the peak in early January 2017 labeled 5 of III below), the jury is still out. Why do I say that? Well, below are some rationales to consider:
(Click on image to enlarge)

- Technical analysis - based on our pattern analysis, and understanding of Elliott Wave Theory, long term critical support comes in at 89.65, as labeled; it has yet to be broken. Until then, the move down from January 2017 can be considered a deep correction.
- Yield spread – there seems a strong correlation between the movement of the US versus Eurozone 10-year yield spread (blue dotted line in the chart above) and the direction of the US dollar index. This of course assumes yield is the driver; we don’t know how much the movement in currencies drives yield; we do know currency prices feedback into fundamentals. But, despite the good growth data flowing from Europe, the Fed’s future path still seems more bullish than the European Central Bank. If so, the yield spread will continue to rise in favor of the US dollar. It could act push the buck higher and surprise the crowd.
- Momentum – weekly momentum (MACD) is turning higher from what seems “oversold” territory. Granted, this in isolation isn’t a strong indicator, but with other supportive evidence it seems a net positive for the bull story.
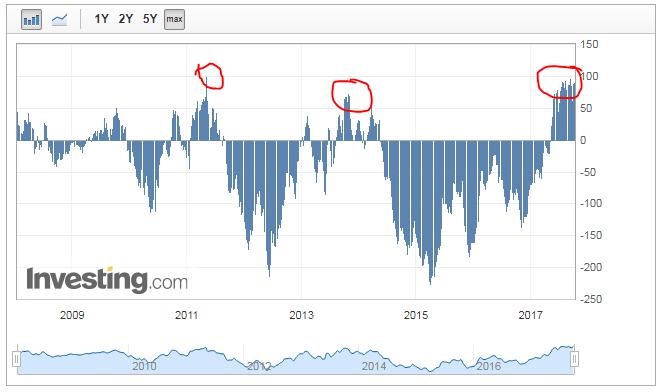
- Positioning – speculators positioning levels in currency futures often provides a good indicator of current sentiment. And when these positioning levels reach extremes—measured by comparing to past peaks and valleys—it often signifies a change of trend may be in the wind. I have attached the most current position chart below (data taken from the Weekly Commitment of Traders Report by the CFTC). Note: I have circled the past “bullish extreme levels” and also noted those levels on the dollar index chart above. In June of 2011 and October 2013, these euro bullish extremes did a pretty good job of defining an intermediate-term bottom in the US dollar index. And interestingly, we are now at a bullish extreme in the euro not seen since 2011.
So, we play our primary expectations, but we should also do our best to remain open to new information that may prove us wrong. Hopefully, if you are a dollar bear, this piece will help.
Disclaimer: Futures, Forex and Option trading involves substantial risk, and may not be suitable for everyone. Trading should only be done with true risk capital. Past performance either actual ...
more

