
US Dollar Drops To Support, AUD/USD Fresh Monthly Highs Ahead Of RBA
US DOLLAR DROPS BACK TO SUPPORT
The US Dollar has started the week by posing a revisit to support in what’s been a fairly active open thus far. On Friday, we got Non-Farm Payrolls numbers for the month of May out of the US and, all-in-all, that report was pretty positive. The headline number beat the expectation, prior monthly revisions saw approximately 15k jobs added to previous tallies, the unemployment rate came in at an 18-year low, and even Average Hourly Earnings surprised to the upside, coming in at an annualized 2.7% versus the expectation of 2.6. So, again, all-in-all, a pretty positive report.
The net response in the US Dollar after NFP was a quick move up to short-term resistance. That held into the close on Friday, and as we opened up this week, prices started to drop and the selling didn’t slow until we moved back down to that prior support zone that runs from 93.63-93.75.
US DOLLAR TWO-HOUR CHART: NFP BOUNCE (IN BLUE) TO RESISTANCE, PULLS BACK TO SUPPORT 93.63-93.75
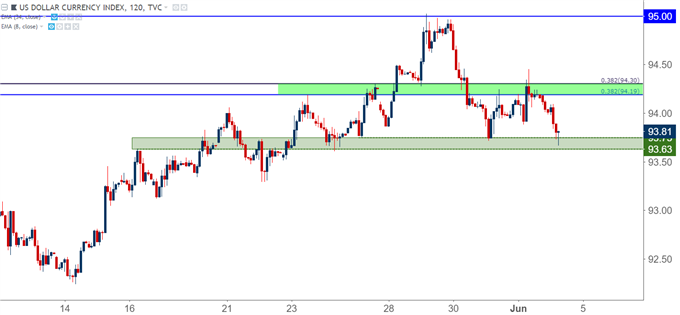
Chart prepared by James Stanley
On a longer-term basis, we’re at an interesting juncture for the US Dollar. Last week’s price action produced a doji after a really strong prior six weeks. This doji printed right at that zone of confluent longer-term resistance that runs from 94.19-94.30; and this has the potential to produce an evening star reversal pattern, which has already started to show given the Dollar’s bearish start to this week.
US DOLLAR WEEKLY CHART: DOJI AT CONFLUENT RESISTANCE HIGHLIGHTS BEARISH REVERSAL POTENTIAL
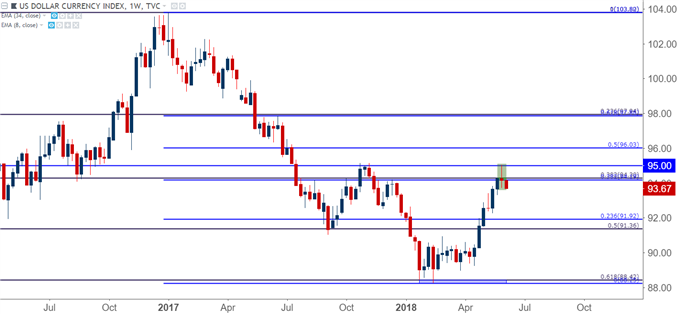
Chart prepared by James Stanley
THIS WEEK’S ECONOMIC CALENDAR IS RATHER LIGHT
There are few high-impact economic data announcements the economic calendar for this week, with the highlight being an RBA rate decision on the schedule for later tonight. More pressing, however, is the possibility of risk-trend being triggered by themes around tariffs or trade wars; or the potential for another wave of volatility as driven by European politics. These themes are a bit more difficult to work with given their brutal unpredictability; but given the importance of each to price action over the past couple of months, traders would be well-served by keeping those scenarios in mind.
DAILYFX ECONOMIC CALENDAR – HIGH-IMPACT EVENTS FOR WEEK OF JUNE 4TH, 2018
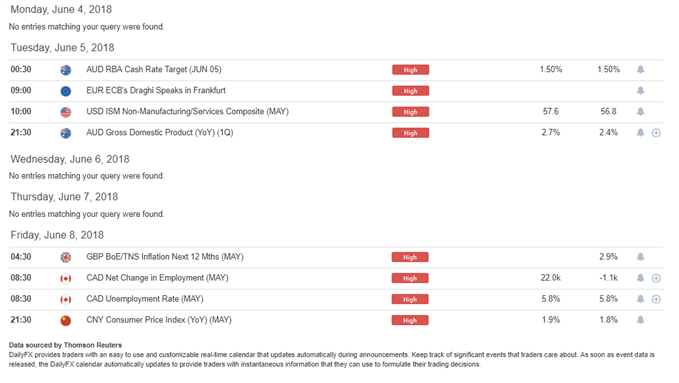
Chart prepared by James Stanley
AUD/USD TO FRESH MONTHLY HIGHS AHEAD OF RBA
Last week, we looked at AUD/USD as one of our more attractive options to play USD-weakness, and we had looked at a similar setup earlier in May, as well. Prices have just hit our first target on last week’s setup, and with fresh monthly highs printing in the pair, the prospect of more keeps the door open on the long side of the market.
With the pair now fast approaching our second target, the strategy is to look for a pullback before adding to the position. The prior resistance level of .7600 can be helpful for such a purpose, as this gave us a strong element of resistance a few weeks ago but, as of yet, hasn’t been tested for higher-low support during this bullish swing.
AUD/USD FOUR-HOUR CHART: BULLISH CONTINUATION POTENTIAL
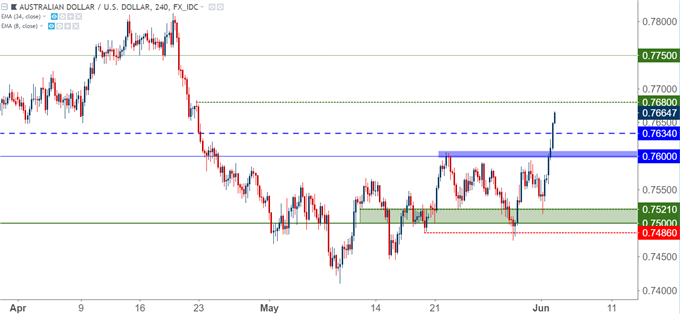
Chart prepared by James Stanley
NZD/USD BACK ABOVE .7000, RANGE FILL POTENTIAL
We’ve also been following the bullish side of NZD/USD as a US Dollar-weakness play, and that setup has also started to fill-in. The backdrop behind this is a multi-year range that’s held in the pair since the summer of 2016. Prices held in the resistance side of that range for much of March and into April, and in mid-April we looked at the short-side of the pair to play the oncoming USD-strength. Five short weeks later and prices were in the support side of that same formation, at which point we started looking at the long side of NZD/USD.
With prices now trading above the .7000 psychological level, the prospect of bullish continuation looks a bit more attractive as prices have moved out of the support side of that range formation.
NZD/USD WEEKLY CHART: BULLISH RANGE-FILL POTENTIAL
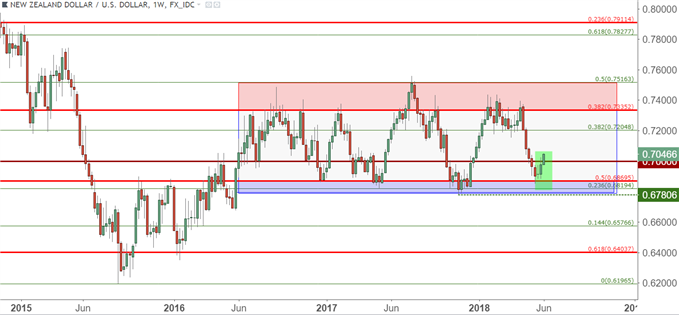
Chart prepared by James Stanley
EUR/USD DEEPER RESISTANCE TEST
With USD-weakness showing rather prominently, EUR/USD is catching a bid and trading deeper within the zone of resistance that we’ve been following. This zone runs from 1.1685-1.1736, and this area helped to show support and resistance on multiple occasions in the latter-third of last year. We saw a bit of support here a couple of weeks ago, but when rampant selling took place in the currency to open last week, prices soon burst lower.
EUR/USD DAILY CHART: PRICES MOVE BACK TO RESISTANCE ZONE 1.1685-1.1736
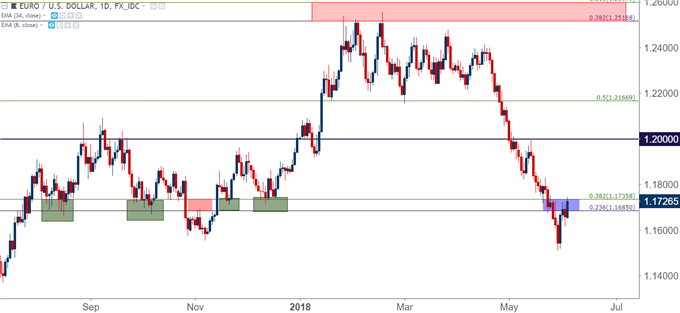
Chart prepared by James Stanley
On the weekly chart, last week’s price action produced a doji here, very similar to what was seen in the US Dollar. Similarly, this highlights the potential for reversal after a failed test of support, and this may be precluding a deeper bullish move before the bearish trend is ready to continue.
EUR/USD WEEKLY CHART: DOJI AT FAILED TEST OF 1.1500
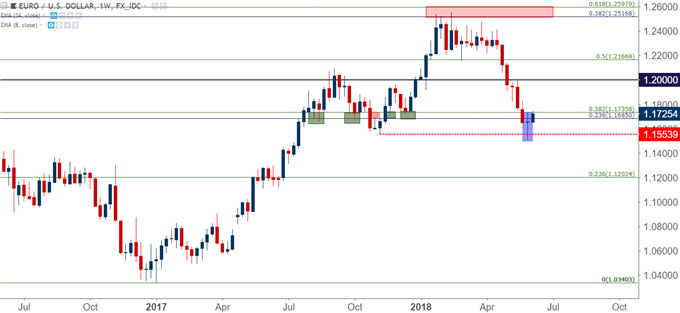
Chart prepared by James Stanley
This highlights the potential for a move back-towards the 1.1821-1.1855 zone. The price of 1.1855 is the 38.2% retracement of the recent bearish move, and we’re currently seeing a respect of resistance at the 23.6% retracement.
EUR/USD FOUR-HOUR CHART: DEEPER RESISTANCE POTENTIAL 1.1821-1.1825
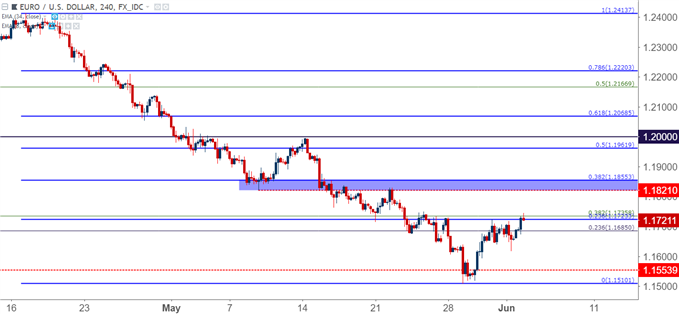
Chart prepared by James Stanley
Disclosure: Do you want to see how retail traders are currently trading the US Dollar? Check out our IG Client Sentiment ...
more

