
US Business Cycle Risk Report - Wednesday, February 28
Jerome Powell, the newly installed chairman of the Federal Reserve, advised in his public debut as head of the central bank that “there’s always a risk of a recession at any point in time, but I don’t see it as at all high at the moment.” Instead, he told the House Financial Services Committee that “I would expect the next two years on the current path to be good years for the economy.”
Looking two years ahead for gauging the state of the business cycle is little more than guesswork, but Powell’s comments about the current state of the US macro trend certainly align with the numbers published to date. Earlier this week, for instance, the Chicago Fed published the January report of its National Activity Index and the three month average posted a moderately high reading of +0.17, far above the -0.70 that marks recession conditions. The profile reflects a slide from the roughly +0.40 level in each of the previous three months, but recession risk remains a minimal threat, based on data available at the moment.
The Capital Spectator’s estimate of recession risk for the US also reflects a low probability for a new downturn through last month, based on a diversified set of economic indicators. Although the macro trend has cooled slightly compared with data for last year’s fourth quarter, the probability is still close to zero that a new contraction has started. (For a more comprehensive review of the macro trend on a weekly basis, see The US Business Cycle Risk Report.)
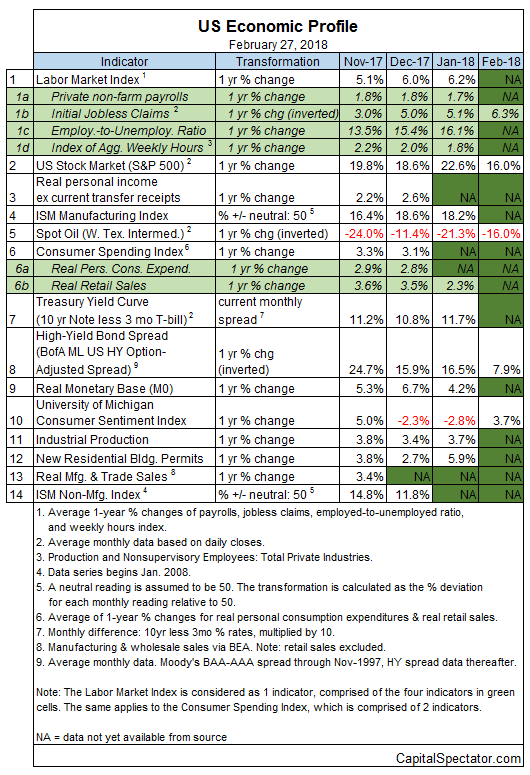
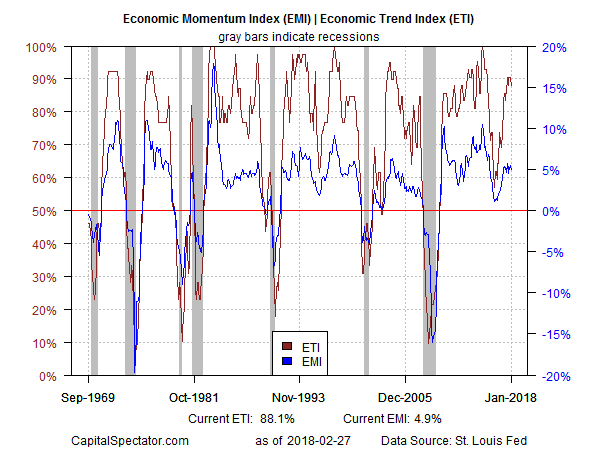
Aggregating the data in the table above continues to translate into a strong positive trend overall. The Economic Trend and Momentum indices (ETI and EMI, respectively) remain well above their respective danger zones (50% for ETI and 0% for EMI). When/if the indexes fall below those tipping points, the declines will mark clear warning signs that recession risk is elevated and a new downturn is likely. The analysis is based on a methodology that’s profiled in my book on monitoring the business cycle.
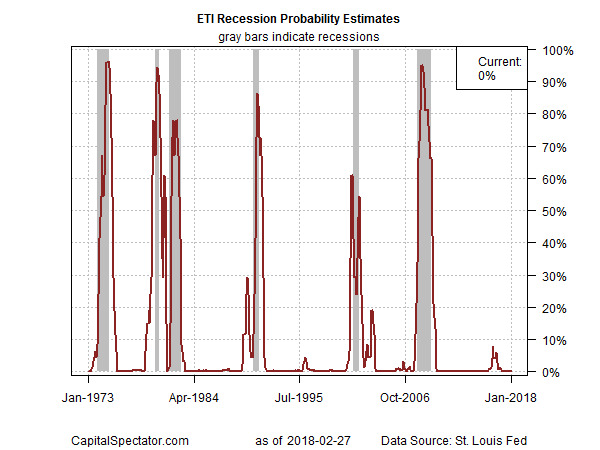
Translating ETI’s historical values into recession-risk probabilities via a probit model also points to low business-cycle risk for the US through last month. Analyzing the data in this framework indicates that the odds remain effectively zero that NBER will declare January as the start of a new recession.
For insight into the near-term outlook, consider how ETI may evolve as new data is published. One way to project values for this index is with an econometric technique known as an autoregressive integrated moving average (ARIMA) model, based on calculations via the “forecast” package in R. The ARIMA model calculates the missing data points for each indicator for each month — in this case through March 2018. (Note that November 2017 is currently the latest month with a full set of published data for ETI.) Based on today’s projections, ETI is expected to remain well above its danger zone through next month.
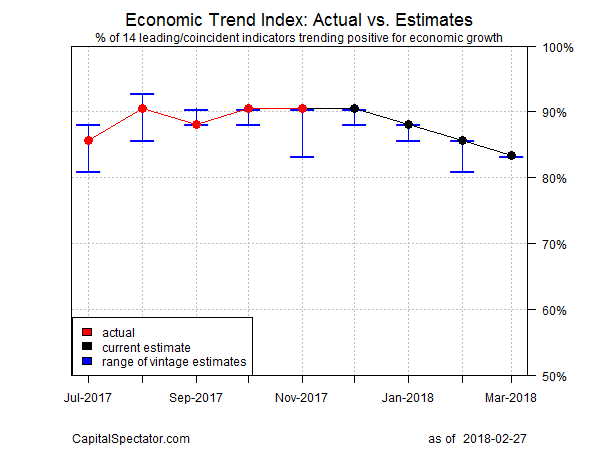
Forecasts are always suspect, but recent projections of ETI for the near-term future have proven to be reliable guesstimates vs. the full set of published numbers that followed. That’s not surprising, given ETI’s design to capture the broad trend based on multiple indicators. Predicting individual components, by contrast, is subject to greater uncertainty. The assumption here is that while any one forecast for a given indicator will likely be wrong, the errors may cancel out to some degree by aggregating a broad set of predictions. That’s a reasonable view, or so one can argue based on the generally accurate historical record for the ETI forecasts in recent years.
The current projections (the four black dots in the chart above) suggest that the economy will continue to expand. The chart above also includes the range of vintage ETI projections published on these pages in previous months (blue bars), which you can compare with the actual data (red dots) that followed, based on current numbers.
For more perspective on the track record of the forecasts, here are the previous business-cycle risk updates for the last three months:
23 Jan 2018
20 Dec 2017
21 Nov 2017
Note: ETI is a diffusion index (i.e., an index that tracks the proportion of components with positive values) for the 14 leading/coincident indicators listed in the table above. ETI values reflect the 3-month average of the transformation rules defined in the table. EMI measures the same set of indicators/transformation rules based on the 3-month average of the median monthly percentage change for the 14 indicators. For purposes of filling in the missing data points in recent history and projecting ETI and EMI values, the missing data points are estimated with an ARIMA model.
Disclosure: None.


