
Unanchored
In a recent article, Amity Shlaes asserts official statistics mismeasure how we experience inflation. I’m going to agree, but not for the reasons you might think. It’s not because John Williams’ Shadowstats, which she appeals to, is right (Jim has comprehensively documented why each and every person who cites that source should be drummed out of the society of economists or aspiring economic commentators). Rather it’s because I think people do have biases — i.e., the steady-state rational expectations hypothesis might not be applicable.
Ms. Shlaes writes in “Inflation Vacation”:
…The price zap is an inflation zap. The reason you thought you could afford this vacation in the first place was that you know a little about money. All the official numbers, especially the Consumer Price Index, say that inflation is reasonable. Economists you respect tell you the wages are low because of “misallocation of resources.” Janet Yellen, the new Fed chairman, says she’s not worried. Maybe she will have a good vacation.
But other numbers suggest that inflation is higher than what the official data suggest. One set, from which some of the price bites above were taken, is here. For a more thorough review of why official numbers err, have a look at the work of John Williams, a consultant who has tracked data over the years.
It’s at this point that I believe the findings by Coibion and Gorodnichenko (2013), discussed earlier by Jim, is of interest. They note that households hold noticeably different expectations regarding inflation than do professional forecasters, or markets; in this sense, household expectations are “unanchored” to the extent that they are consistently higher than ex post realizations of inflation.
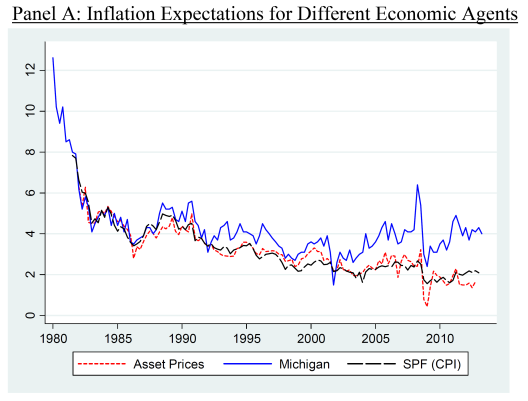
Source: Figure 6, Panel A, Coibion and Gorodnichenko.
Why does this pattern arise? From the paper:
…why did households hold such different beliefs than professional forecasters? Our suggested answer can be seen in … Figure 7. Household inflation forecasts have tracked the price of oil extremely closely since the early 2000s, with almost all of the short-run volatility in inflation forecasts corresponding to short-run changes in the level of oil prices. From January 2000 to March 2013, for example, the correlation between the two series was 0.74. In contrast, the correlation between SPF inflation forecast and oil price over the same period was -0.12. The strong sensitivity of consumers’ inflation expectations to oil price has historically been strong: the correlation between MSC inflation expectations and real oil price over 1960-2000 was 0.67.
Here is Figure 7:
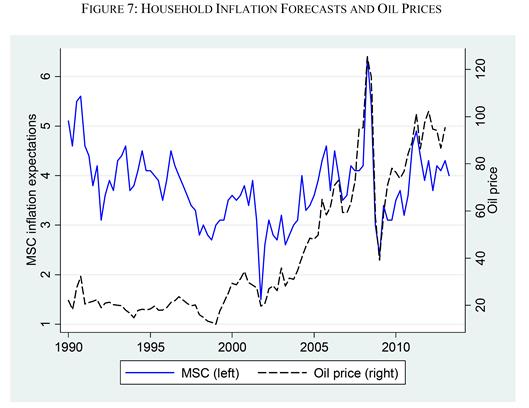
Source: Figure 7, from Coibion and Gorodnichenko.
Households that tend to have more gasoline expenditures tend to be more sensitive to oil prices. This further buttresses the view that expectations differ from professional forecasters, and market based measures which are unbiased. See more on the characteristics of household surveys by R. Waldmann/Angry Bear.
On another count, Ms. Shlaes discounts both hedonics and price index theory:
The Bureau of Labor Statistics or the Fed also argued that the quality of some items (camera, movie) had improved over the years. The technology it took to make X-Men: Days of Future Past is leagues ahead of the technology used for Gladiator. The movie theater itself has better seats. Therefore, the ticket price should be higher. The economists at the BLS say they discount for that: “The hedonic quality adjustment method removes any price differential attributed to change in quality,” they write. But perhaps they use such indexes to hide true price increases.
And:
Decades ago, authorities pointed out that people substitute a cheaper item when what they originally bought was too expensive. They altered the index to capture substitution. If steak is expensive, you buy chicken. The result of their fiddle is that inflation looks lower than it would otherwise. That’s disappointing. No vacation is a true vacation without a really good tenderloin.
On the first point — hedonics — it’s telling that movies were mentioned, but not telecommunications. From my standpoint, I can say there has been a big increase in what my smartphone can do relative to my first mobile phone in 2000.
On the second point, this observation is funny because the CPI is a quasi-Laspeyres index (see this post), so it tends to minimize (although not completely eliminate) the effect she speaks of. Now, it’s true that the index weights are updated each two years, but even then, those with an acquaintance of price index theory understand that in the absence of the true underlying utility function of consumers, measuring the “true” rate of inflation is infeasible, and the Laspeyres index tends to over-state the rate of inflation (the chained CPI inflation rate tends to be lower than that obtained using the standard quasi-Laspeyres CPI).
Actually, I suspect that the reported inflation rate actually understates the inflation relevant to Ms. Shlaes, if her household is in the upper 25% income decile. That’s because the CPI weights are appropriate to a household at the 75% income decile (see this post on plutocratic vs. democratic price indices). Those at lower income levels are likely facing a higher inflation rate than she does.
One point where I do disagree vociferously with Ms. Shlaes assessment is here, where she discusses the Liesman-Santelli exchange (discussed in this post):
If you study the last part of the video, where the CNBC host gets bullied into silence by Steve Liesman, you’ll see the problem. The price today for talking about inflation is itself too high.
Lots of people have been discussing inflation and hyper-inflation for the past six years. I don’t think the costs are that high at all. And in fact I expect to hear more inflation worries, day after day.
Final point: to the extent that the CPI growth has changed over time, it is interesting to consider the price level counterfactual implied by the inflation rate over the 2001M01-2009M01 period. This is shown in Figure 1.
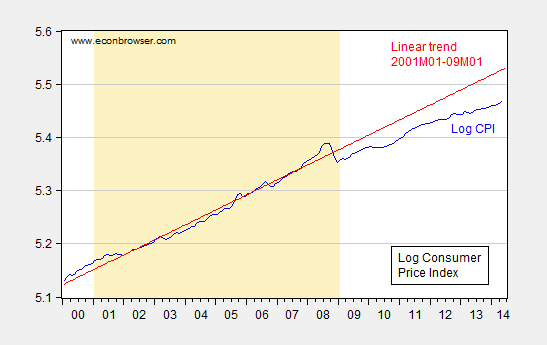
Figure 1: Log CPI (blue) and linear trend estimated over 2001M01-09M01 period (red). Sample period for estimation of trend shaded tan. Source: BLS (May 2014 release) via FRED and author’s calculations.
It certainly looks to me that inflation is lower (i.e., the slope is flatter) post 2008 than before. Biases that existed in the past regarding “zaps” exist now. Indeed, if anything one bias that existed before — due to imputation of owner occupied rent — is probably resulting in an overstatement of inflation right now.
Disclosure: None.


