
Two Huge Warning Signs - The 8-Year Bull Market Birthday And The 10-Year Low VIX Reading
Do you know who isn't worried about a market collapse these days? As far as I can tell it is almost everyone!
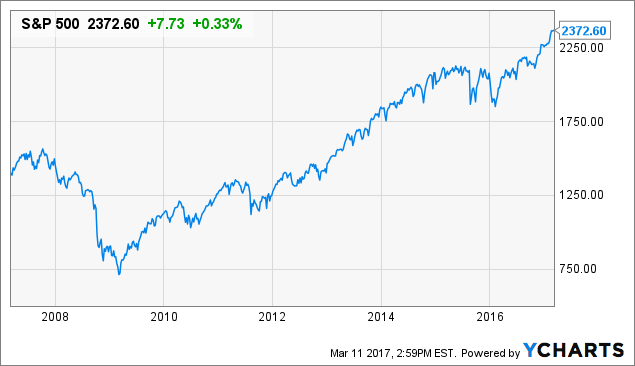
Look at that chart below. The market (NYSEARCA:SPY ) just keeps rising and rising.
Perhaps there is nothing more concerning than the fact that investors don't feel like risk levels are heightened today. That is generally exactly when we should be sounding the alarm bells.
I'd like to offer a few points that I think investors should be considering today.
Alarm Bell #1 - A 10-Year Low VIX Reading
Last week the VIX index which is a measure of market volatility hit 11.6. That is its lowest point in a decade. Historically, 20 is about normal and 60 represents all-out panic like what we saw in the worst of the 2008 crisis.
When we hit 60, you are probably going to want to be a buyer of stocks. When you hit an all-time low, you should likely be doing the opposite.
The last time we saw the VIX this low was in 2007. Yes, at that point we should have been getting extremely worried as we were months away from the Lehman Brothers moment.
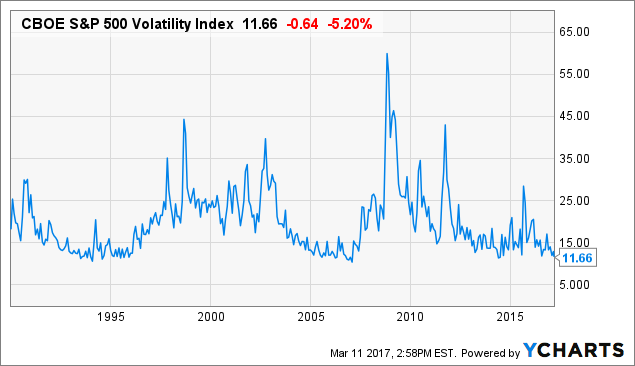
After an extremely long bull market, clearly, a VIX reading this low tells us that investors are not losing any sleep thinking about a market crash.
Alarm Bell #2 Happy Birthday - The Bull Is Now Eight Years Old (About 115 in Human Years)
The current bull market which began in March 2009 just celebrated its eighth birthday. We are now in the second longest bull-run in the history of the S&P 500.
Like with the really low VIX reading, history shows that the longest bull markets do not end with a gentle leveling off. Then end with an elevator ride straight down.
Check out what has happened when the other historically long bull markets have ended:
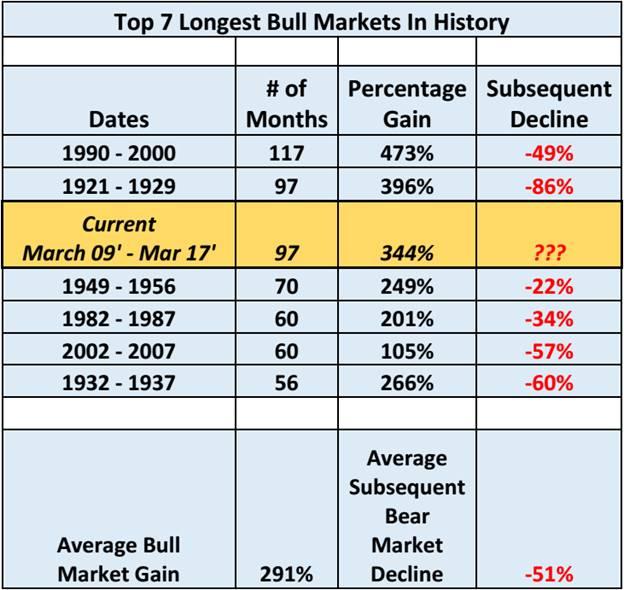
Data for chart: Yahoo Finance
Please do me a favor and actually take a hard look at the right hand column. When these really long bull markets end, the market does not go into a gentle decline. It goes into a steep drop.
The smallest post long bull market decline is 22 percent. The average is 51 percent.
Drink that in, history tells us that we can expect the market to decline by 51 percent if it behaves as it has in the past.
The decline might not be that much, but it might be more. Either way, the range of outcomes based on history is not appealing.
Keep in mind this is historical data not my opinion.
What Is An Investor To Do?
What I hope that you will take away from this article is that now is a time for patience and careful investment selection. Continuing to dump money blindly into an S&P 500 index fund today is not the way to go.
The huge amounts of money that have been pumped into S&P 500 index funds have pushed valuations higher slowly. We've had a long and steady eight-year stock market increase.
When it turns in the other direction, it won't be a slow and steady decline. You won't believe how fast that money is going to come out of index funds once investors have a reminder that equity investing can be a scary experience.
What went up slow, will come down really, really fast.
Thanks for reading.
Disclosure: I don’t own any shares of companies mentioned in this article.


