
Trucking Growth Is Up Or Down Year-Over-Year In March 2018. Depends On What Data You Believe
Headline data for truck shipments was conflicted year-over-year.

Analyst Opinion of Truck Transport
I tend to put heavier weight on the CASS index which showed strong rate of growth improvement year-over-year. However, both indicies are showing strong YoY growth.
It should be pointed out that the trucking movements are improving YoY.
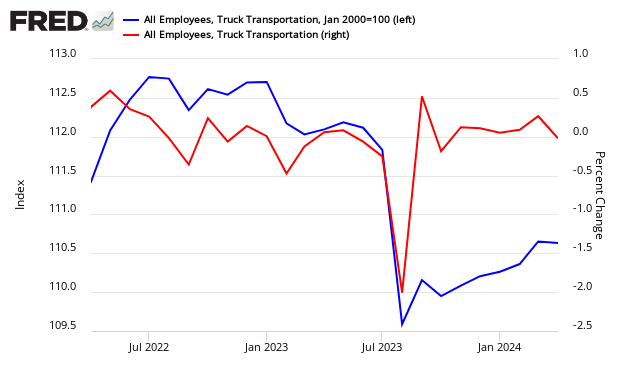
ATA Trucking
American Trucking Associations' advanced seasonally adjusted (SA) For-Hire Truck Tonnage Index eclined 1.1% in March after easing 0.8% in February. n March, the index equaled 110 (2015=100), down from 111.2 in February.
Said ATA Chief Economist Bob Costello:
Despite a softer March and February, truck freight tonnage remains solid as exhibited in the year-over-year increase of 6.3%. While I expect the pace of growth to continue moderating in the months ahead, if for no other reason than year-over-year comparisons will become more difficult as tonnage snapped back in May of 2017, the levels of freight will remain good going forward.
ATA Truck tonnage this month
(Click on image to enlarge)

z truck.jpg
Compared with March 2017, the SA index jumped 6.3%, which was below February's 7.7% year-over-year gain, but still well above 2017's annual increase. For all of 2017, the index increased 3.8% over 2016. In the first quarter of this year, tonnage rose 0.9% and 7.4% from the previous quarter and a year earlier, respectively.
Econintersect tries to validate ATA truck data across data sources. It appears this month that jobs growth says the trucking industry employment levels were improved month-over-month. Please note using BLS employment data in real time is risky, as their data is normally backward adjusted (sometimes significantly).
(Click on image to enlarge)
This data series is not transparent and therefore cannot be relied on. Please note that the ATA does not release an unadjusted data series (although they report the unadjusted value each month - but do not report revisions to this data) where Econintersect can make an independent evaluation. The data is apparently subject to significant backward revision. Not all trucking companies are members of the ATA, and therefore it is unknown if this data is a representative sampling of the trucking industry.
source: ATA
CASS FREIGHT INDEX REPORT
Volume Strong, Pricing Even Stronger - Heavy Industrial Segment of Trucking Exploding
Although seasonally the weakest part of the year, the first quarter of 2018 is clearly signaling that, barring a 'shock event', 2018 will be an extraordinarily strong year for transportation and the economy. March exceeded all levels in 2014 (a very strong year); February was roughly equal to the peak month in 2014 (June 2014 - 1.201 vs February 2018 - 1.198) which is extraordinary. A YoY stacked chart highlights that, similar to the pattern which began in November and December 2017, the shipments index is exceeding all previous respective months.
The YoY percentage change is notable because the freight recovery started in the second half of 2016 (i.e., tougher comparison) and because only when comparisons were weak (i.e., 2009-2010) were the percentage increases so high. Said another way, we normally only see such high percentage increases in volume when related to easy comparisons. That these percentage increases are so strong and strong against tough comparisons explains why our outlook is so bullish, why capacity is so constrained, and why realized pricing is so strong.
(Click on image to enlarge)

Disclosure: None.


