
Triangle On USD/MXN Points Lower
Good day traders! Today's focus is on USDMXN, its 4h and 1h development.
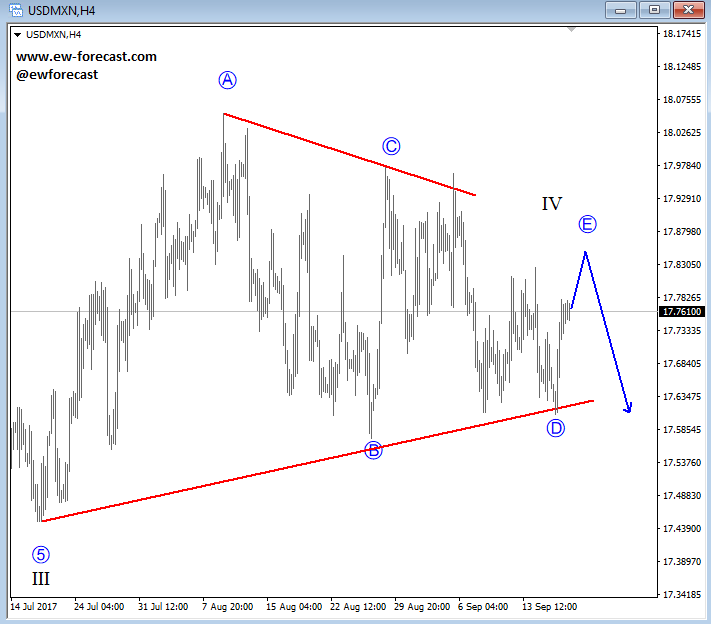
USD/MXN is trading slow, choppy and overlapping for the last two months, which indicates a triangle pattern in the making. Ideally, this complex pattern is now trading in final stages and will make a new reversal lower, once the final leg E finds its resistance.
USDMXN, 4H
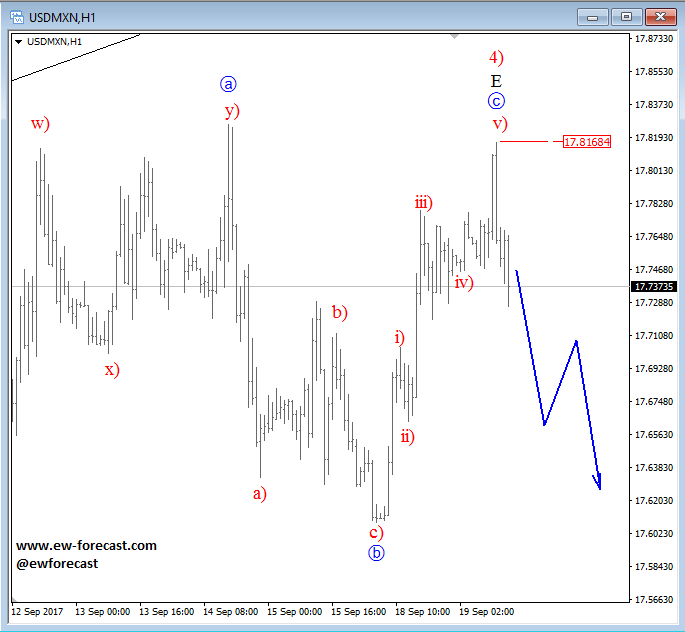
On the 1h chart, we can take a better look at leg E, which also unfolded quite complex. Current leg E can be a flat correction that may have just found a top at the 17.8168 level and can now make a five -wave drop lower. A five-wave drop will indicate a bearish continuation.
USDMXN, 1H
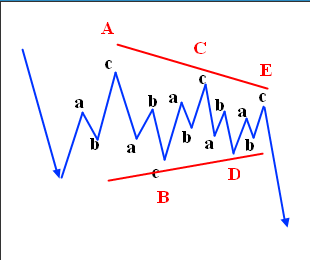
Triangles are overlapping five wave affairs that subdivide 3-3-3-3-3. They appear to reflect a balance of forces, causing a sideways movement that is usually associated with decreasing volume and volatility.
Triangle pattern:
Disclosure: Please be informed that information we provide is NOT a trading recommendation or investment advice. All our work is for educational purposes only.


