
Trends For New Home Sale Prices At The Beginning Of 2018
At the beginning of 2018, we find that median new home sale prices are continuing to follow the upward trajectory that they have since September 2015, where they are escalating at an average rate of $942 each month.
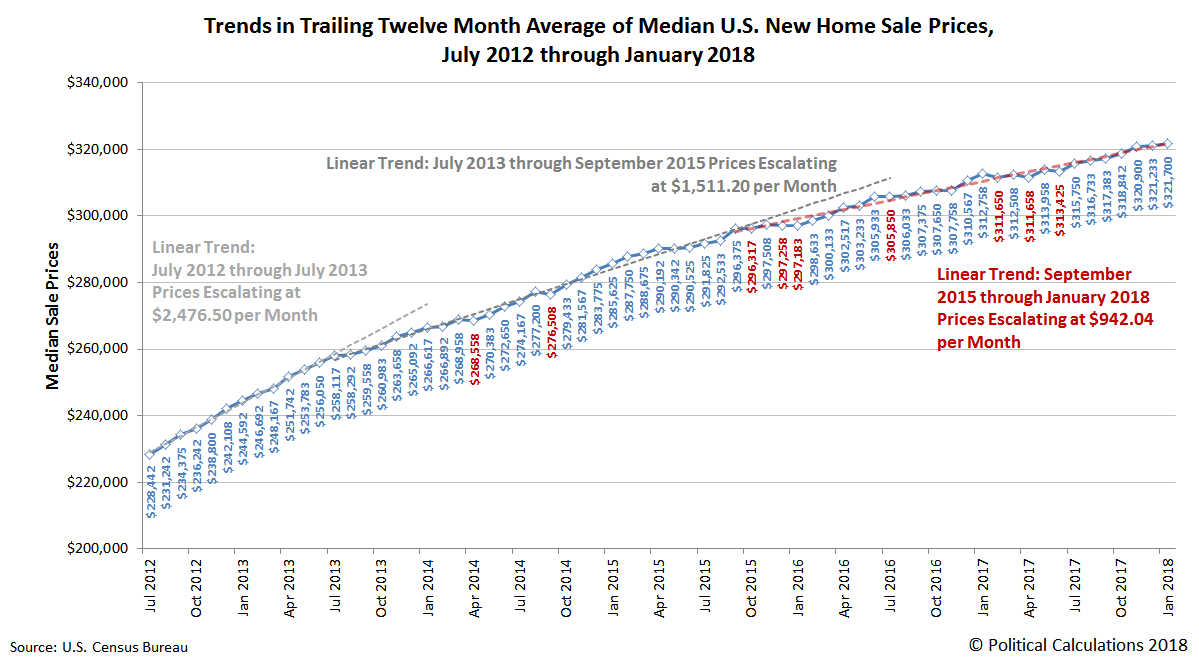
That steady pace of growth is the slowest rate of change for median new home sale prices recorded over the previous 5-6 years, which have been dominated by three major trends. In the two years prior to the current trend, they were increasing at $1,511 per month and if we go back to the year from July 2012 to July 2013, when Wall Street investors aided by the Obama administration shrank the total supply of housing on the market in the U.S. by buying up thousands of foreclosed homes, is much slower than the average $2,476 per month increases that were recorded during that period of shortage-driven housing price inflation.
In our next chart, we'll go back to the beginning of the current century, where we'll map the relationship between median new home sale prices and median household income:
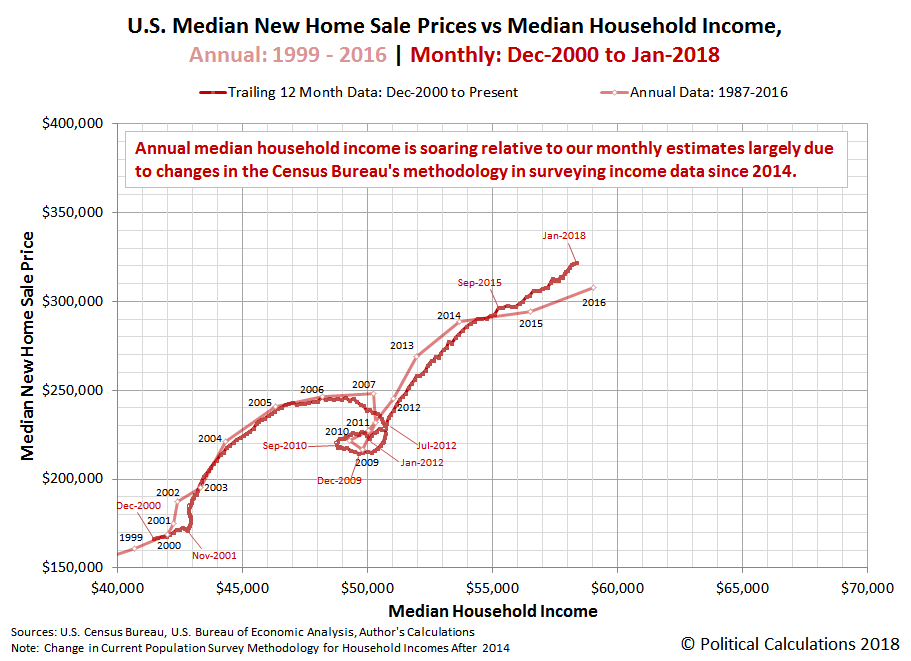
The period from December 2000 through the present captures the impact of the shortage-driving housing bubbles that have dominated the U.S. new home market, where median house prices have skyrocketed with respect to median household incomes.
We do need to note that the annual median household income estimates since 2014 are showing considerably faster growth for this household demographic characteristic compared to the period ending in 2014, which is largely a consequence of changes in the U.S. Census Bureau's methodology for collecting income data in its ongoing Current Population Survey. We are currently working on a project that will better take those changes into account that will lead us to revise our monthly estimates of median household income, where we are currently engaged in the very slow process of accumulating data.
Getting back to the trends in new home sale prices, the following chart shows all the data that we have available for depicting the trends in the relationship between median new home sale prices and median household income going back to 1967, which is the earliest year for which the U.S. Census Bureau reports median household income.

The amazing thing is how linear the trends were before the era of the housing bubbles began!
Data Sources
U.S. Census Bureau. Median and Average Sales Prices of New Homes Sold in the United States. [PDF Document]. Last Updated: 26 February 2018.
U.S. Bureau of Economic Analysis. Table 2.6. Personal Income and Its Disposition, Monthly, Personal Income and Outlays, Not Seasonally Adjusted, Monthly, Middle of Month. Population. [Online Database (via Federal Reserve Economic Data)]. Last Updated: 1 March 2018.
U.S. Bureau of Economic Analysis. Table 2.6. Personal Income and Its Disposition, Monthly, Personal Income and Outlays, Not Seasonally Adjusted, Monthly, Middle of Month. Compensation of Employees, Received: Wage and Salary Disbursements. [Online Database (via Federal Reserve Economic Data)]. Last Updated: 1 March 2018.
Disclaimer: Materials that are published by Political Calculations can provide visitors with free information and insights regarding the incentives created by the laws and policies described. ...
more

