
Trendline Support Breaks
I was looking at two important trendline support levels on Friday morning, and both of them broke down in the afternoon. The pattern from the 2001 low has fixed as a rising wedge and that should now be in a short term topping process. SPX 1min chart:

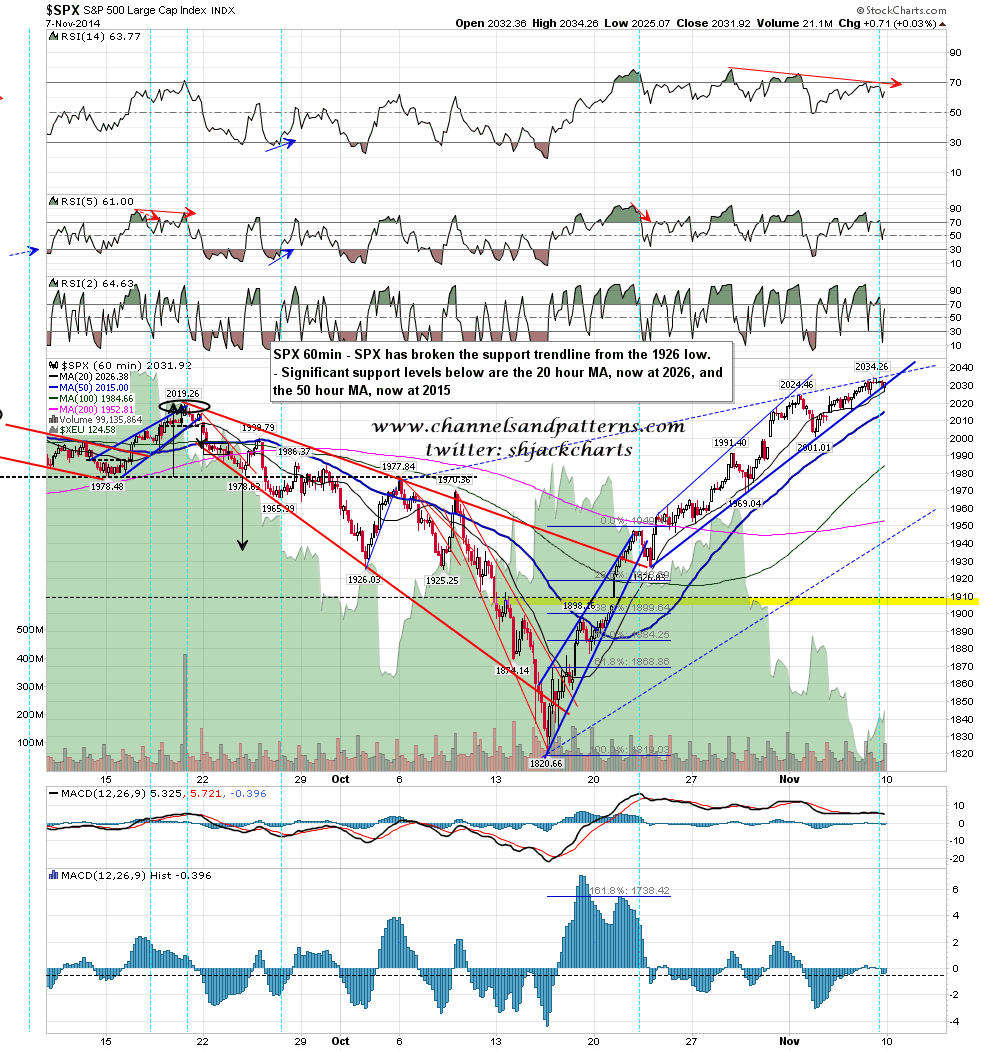
Rising support from the 1926 low also broke down in the afternoon. Once the 20 hour MA breaks I’d be looking for at least a test of the 50 hour MA, currently at 2015. SPX 60min chart:
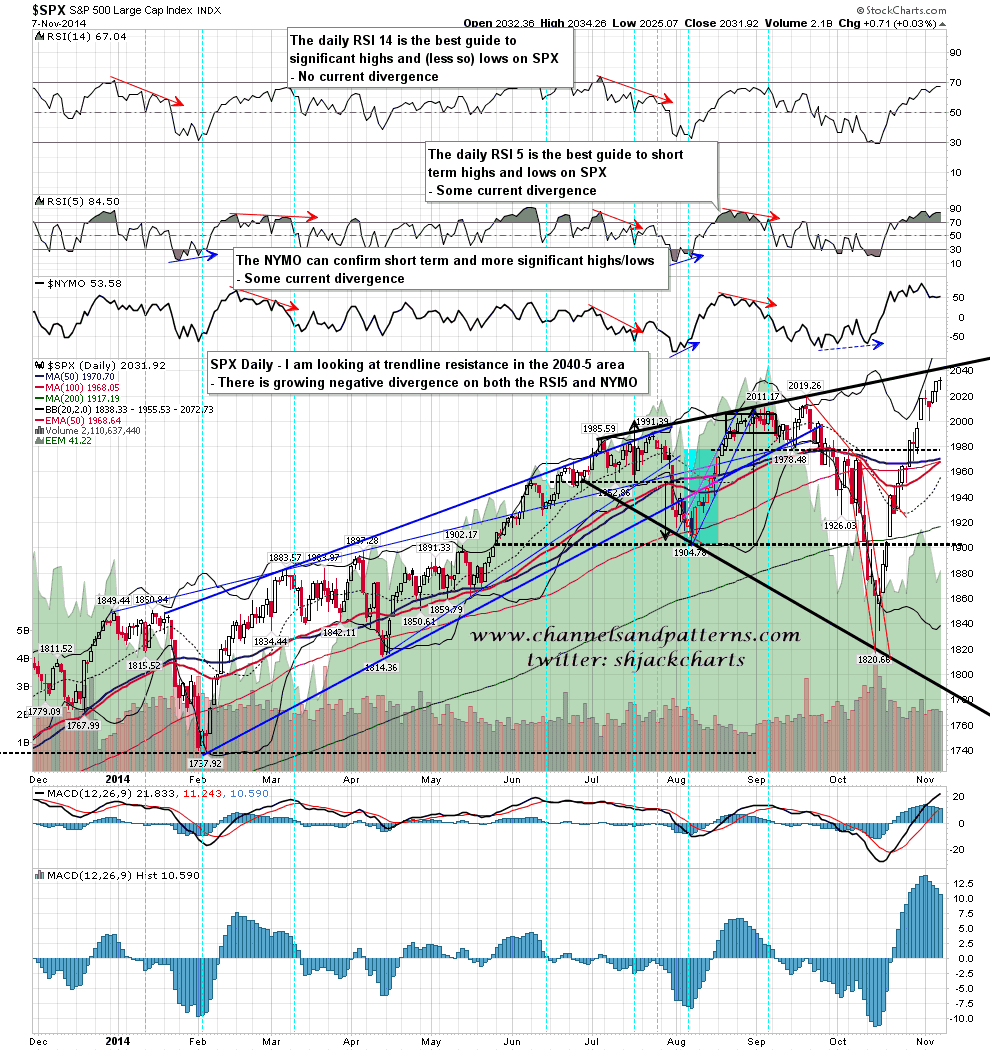
I still have decent trendline resistance in the 2040-5 area. I’m doubtful about that being reached before a short term retracement, but it’s still just in range I think, so maybe. SPX daily chart:
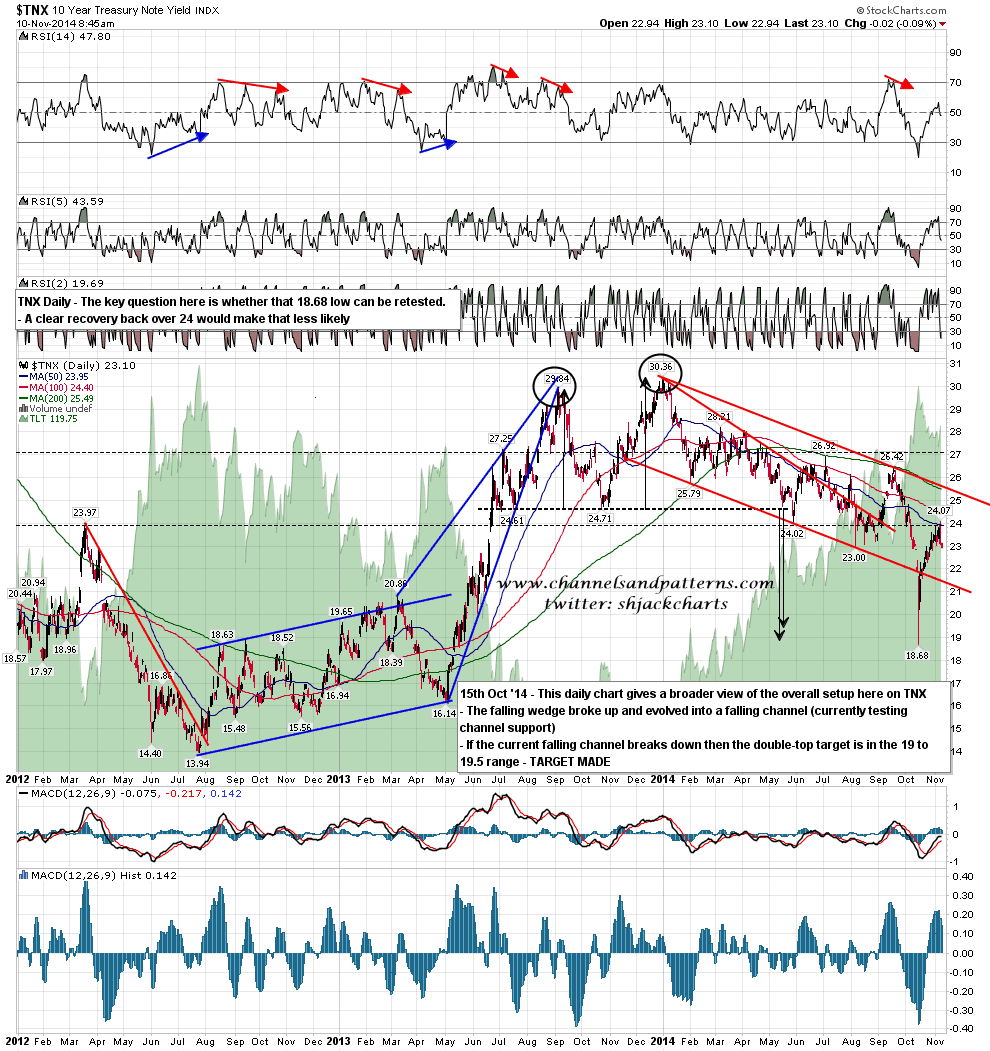
I’ve been wrestling with the bonds charts in recent days for clues as to where bonds may be headed next. On the TNX chart there is still a possibility that the 18.68 low could be retested. A recovery back over 24 would make that much less likely in my view. TNX daily chart:
Ideally I’m looking for a marginal new high today followed by a retracement this week that might just manage to retest 2000. After that I’d be looking for another move up.
This blog is not, and have never been, investment advice. It is a place that allows me to express my own views on the market and specific securities – as well as make whatever cultural ...
more

