
Top Five Buy/Strong Buy Upgrades - April 4, 2016
For today's bulletin we used our website's advanced screening functions to search for UPGRADES to BUY or STRONG BUY with complete forecast and valuation data. They are presented by one-month forecast return. IEC Electronics Corp (IEC) is the leader here.
|
Ticker |
Company Name |
Market Price |
Valuation |
Last 12-M Return |
1-M Forecast Return |
1-Yr Forecast Return |
P/E Ratio |
Sector Name |
|
IEC ELECTRS NEW |
4.63 |
-13.39% |
26.85% |
1.18% |
14.25% |
14.03 |
Computer and Technology |
|
|
REYNOLDS AMER |
50.33 |
-31.83% |
43.13% |
0.73% |
8.71% |
24.79 |
Consumer Staples |
|
|
BIOTELEMETRY |
11.8 |
-14.75% |
32.14% |
0.67% |
8.06% |
24.08 |
Medical |
|
|
TUCOWS INC |
22.64 |
-18.98% |
19.16% |
0.65% |
7.78% |
20.96 |
Computer and Technology |
|
|
HORMEL FOODS CP |
43.91 |
-28.77% |
53.80% |
0.62% |
7.45% |
30.49 |
Consumer Staples |
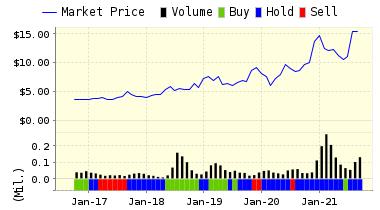
Below is today's data on IEC Electronics Corp (IEC):
IEC Electronics Corp. is a full service, ISO 9001 and 9002 certified, contract manufacturer employing state-of-the-art production utilizing both surface mount and pin-through-hole technology. IEC offers its customers a wide range of manufacturing and management services, on either a turnkey or consignment basis, including design prototyping, material procurement and control, concurrent engineering services, manufacturing and test engineering support, statistical quality assurance and complete resource management.
VALUENGINE RECOMMENDATION: ValuEngine updated its recommendation from HOLD to BUY for IEC ELECTRS NEW on 2016-04-01. Based on the information we have gathered and our resulting research, we feel that IEC ELECTRS NEW has the probability to OUTPERFORM average market performance for the next year. The company exhibits ATTRACTIVE Momentum and Price Sales Ratio.
|
ValuEngine Forecast |
||
|
Target |
Expected |
|
|---|---|---|
|
1-Month |
4.68 | 1.18% |
|
3-Month |
4.68 | 1.04% |
|
6-Month |
4.70 | 1.56% |
|
1-Year |
5.29 | 14.25% |
|
2-Year |
4.55 | -1.75% |
|
3-Year |
3.61 | -21.93% |
|
Valuation & Rankings |
|||
|
Valuation |
13.39% undervalued |
Valuation Rank(?) |
|
|
1-M Forecast Return |
1.18% |
1-M Forecast Return Rank |
|
|
12-M Return |
26.85% |
Momentum Rank(?) |
|
|
Sharpe Ratio |
-0.32 |
Sharpe Ratio Rank(?) |
|
|
5-Y Avg Annual Return |
-12.51% |
5-Y Avg Annual Rtn Rank |
|
|
Volatility |
39.02% |
Volatility Rank(?) |
|
|
Expected EPS Growth |
54.55% |
EPS Growth Rank(?) |
|
|
Market Cap (billions) |
0.05 |
Size Rank |
|
|
Trailing P/E Ratio |
14.03 |
Trailing P/E Rank(?) |
|
|
Forward P/E Ratio |
9.08 |
Forward P/E Ratio Rank |
|
|
PEG Ratio |
0.26 |
PEG Ratio Rank |
|
|
Price/Sales |
0.36 |
Price/Sales Rank(?) |
|
|
Market/Book |
4.66 |
Market/Book Rank(?) |
|
|
Beta |
0.31 |
Beta Rank |
|
|
Alpha |
0.17 |
Alpha Rank |
|
ValuEngine Market Overview
|
Summary of VE Stock Universe |
|
|
Stocks Undervalued |
59.02% |
|
Stocks Overvalued |
40.98% |
|
Stocks Undervalued by 20% |
25.93% |
|
Stocks Overvalued by 20% |
12.47% |
ValuEngine Sector Overview
|
Sector |
Change |
MTD |
YTD |
Valuation |
Last 12-MReturn |
P/E Ratio |
|
0.43% |
0.47% |
4.84% |
9.79% overvalued |
-1.84% |
24.17 |
|
|
0.08% |
0.17% |
7.03% |
7.66% overvalued |
-0.33% |
23.46 |
|
|
0.27% |
0.36% |
17.48% |
6.28% overvalued |
-6.06% |
26.00 |
|
|
-0.78% |
-0.68% |
4.00% |
3.20% overvalued |
-10.33% |
17.12 |
|
|
0.26% |
0.32% |
3.00% |
2.52% overvalued |
-9.25% |
22.27 |
|
|
-0.09% |
0.06% |
4.06% |
1.52% overvalued |
-12.59% |
19.17 |
|
|
-0.14% |
-0.09% |
2.12% |
2.24% undervalued |
-8.77% |
24.56 |
|
|
0.04% |
0.07% |
13.80% |
3.13% undervalued |
-5.42% |
21.76 |
|
|
-0.04% |
0.03% |
4.43% |
3.13% undervalued |
-7.59% |
27.30 |
|
|
0.01% |
0.04% |
-1.52% |
3.90% undervalued |
-6.87% |
15.94 |
|
|
-0.10% |
-0.06% |
-3.15% |
4.14% undervalued |
-13.16% |
19.87 |
|
|
-0.32% |
-0.26% |
0.56% |
5.69% undervalued |
-12.34% |
22.67 |
|
|
-1.99% |
-1.70% |
-0.85% |
9.24% undervalued |
-36.46% |
22.08 |
|
|
-2.18% |
-1.90% |
-0.48% |
9.49% undervalued |
-15.69% |
12.20 |
|
|
-1.01% |
-0.95% |
0.54% |
12.35% undervalued |
-28.56% |
13.36 |
|
|
0.96% |
1.08% |
-6.32% |
12.86% undervalued |
-20.21% |
25.94 |
VALUATION WATCH: Overvalued stocks now make up 40.98% of our stocks assigned a valuation and 12.47% of those equities are calculated to be overvalued by 20% or more. Six sectors are calculated to be overvalued.
Disclosure: None.
Disclaimer: ValuEngine.com is an independent research provider, producing buy/hold/sell recommendations, ...
more

